
U.S. Greenhouse Gas Inventory Report: 1990-2014
About the Emissions Inventory
EPA develops an annual report called the Inventory of U.S. Greenhouse Gas Emissions and Sinks (Inventory). This report tracks total annual U.S. emissions and removals by source, economic sector, and greenhouse gas going back to 1990. EPA uses national energy data, data on national agricultural activities, and other national statistics to provide a comprehensive accounting of total greenhouse gas emissions for all man-made sources in the United States. EPA also collects greenhouse gas emissions data from individual facilities and suppliers of certain fossil fuels and industrial gases through the Greenhouse Gas Reporting Program.
The national greenhouse gas inventory is submitted to the United Nations in accordance with the Framework Convention on Climate Change. In preparing the annual emissions inventory report, EPA collaborates with hundreds of experts representing more than a dozen U.S. government agencies, academic institutions, industry associations, consultants, and environmental organizations.
Overview of Greenhouse Gases and Sources of Emissions
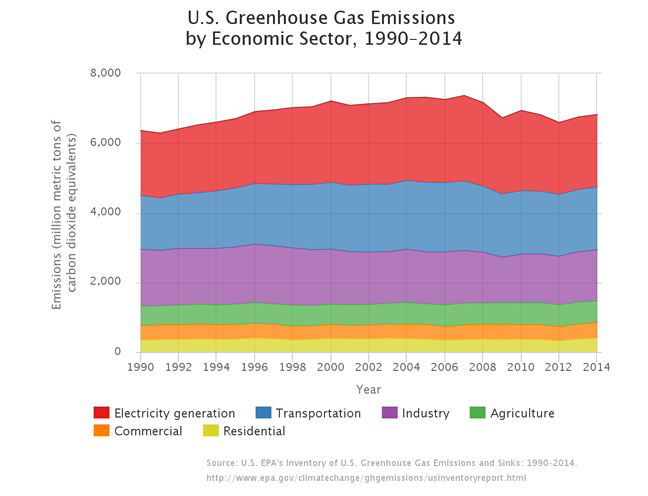
Key findings from the 1990–2014 U.S. Inventory include:
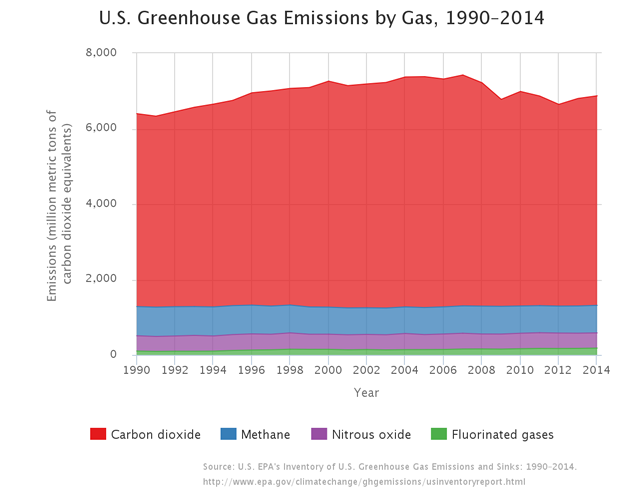
- In 2014, U.S. greenhouse gas emissions totaled 6,870 million metric tons of carbon dioxide equivalents.
- U.S. emissions increased by 1 percent from 2013 to 2014. Recent trends can be attributed to multiple factors driving increased fuel use including year-to-year changes in the prevailing weather and an increase in miles traveled by on-road vehicles.
- Greenhouse gas emissions in 2014 were 9 percent below 2005 levels.
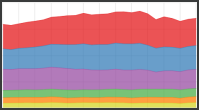
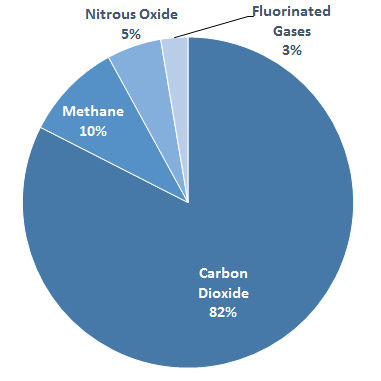
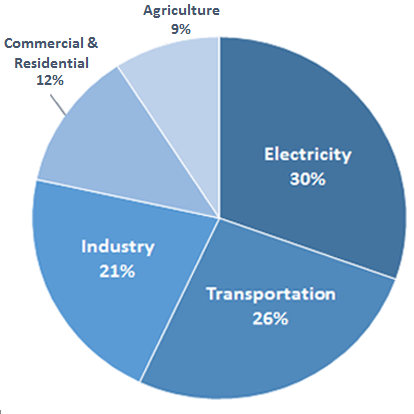
The graphs below provide an overview of greenhouse gas emissions in the United States based on information from the Inventory. Click the links below each chart to learn more about each of these topics. See our Fast Facts Fact Sheet for an overview of the GHG emissions data from the report.
See the Data
EPA has developed an interactive tool that provides access to data from the national greenhouse gas inventory. Visit the Greenhouse Gas Inventory Data Explorer to create customized graphs, examine trends over time, and download the data.
The graphs below are examples from EPA’s Greenhouse Gas Inventory Data Explorer. Click either image to enter the tool and explore an interactive version of the graph.
Full Report
View or download the Inventory of U.S. Greenhouse Gas Emissions and Sinks: 1990–2014 (April 2016), including an executive summary, individual chapters, report tables, and annexes.