
Environmental Quality Index (EQI)
The Environmental Quality Index (EQI) presents data in five domains: air, water, land, built, and sociodemographic environments to provide a county-by-county snapshot of overall environmental quality across the entire U.S. The EQI helps researchers better understand how health outcomes relate to cumulative environmental exposures that typically are viewed in isolation.
Because the air we breathe, the water we drink, the food we eat, and the buildings around us all play a part in our overall wellbeing, researchers can use the EQI to investigate and highlight associations between environmental quality and a given health concern. By expanding research beyond singular routes of exposure and pollutants, the EQI helps provide a clearer picture of the relationship between the environment and health. To support this scientific exploration, EPA has made the EQI and its many variables open and accessible to the public. You can learn more about the EQI under downloads below.
Since the release of the EQI 2000-2005, researchers have published multiple studies examining the relationship between overall environmental quality and health outcomes, including preterm birth, mortality, cancer incidence, asthma prevalence, physical inactivity and obesity, infant mortality, and pediatric multiple sclerosis. You can find EQI related publications below.
EQI data can also be used by ecologists, economists, and other researchers to address questions about environmental quality.
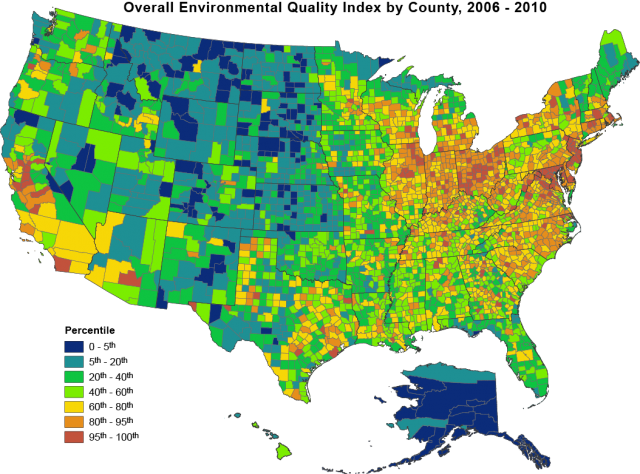
At its current county-level scale, the EQI may not reveal environmental challenges seen at the local community level. However, it does highlight counties experiencing an increased burden of environmental impacts, and the domain-specific indices enable counties to assess the drivers contributing to the environmental conditions in their counties. Examining these factors could provide a foundation for targeted support to address health concerns tied to environmental quality.
Because modifications were made to the updated EQI 2006-2010, direct comparisons between EQI 2000-2005 and EQI 2006-2010 should not be made. The two indices should not be examined as being continuous over time (e.g., if a study period covers 2004-2007, only one of the indices should be chosen or study population should be stratified by time period matched to the appropriate EQI). Furthermore, the EQI was developed for research purposes and is not meant to be a diagnostic tool. The EQI would be useful to identify potential areas of concern for counties to target future research, but it should not be used to target regulatory purposes.
History of EQI
| Date | Milestone |
|---|---|
| Feb 2021 | EPA released an update to the Environmental Quality Index Technical Report based on county data from 2006-2010. |
| Sep 2014 |
EPA released the document Creating an Environmental Quality Index Technical Report, Overview Report and dataset (see downloads). This was based on county data from 2000-2005. |
Downloads
EPA Reports
- U.S. EPA (2020). Environmental Quality Index - Technical Report, 2006-2010. U.S. Environmental Protection Agency, Washington, DC, EPA/600/R-20/367.
- U.S. EPA (2014). Creating an Overall Environmental Quality Index - Technical Report, 2000-2005. U.S. Environmental Protection Agency, Washington, DC, EPA/600/R-14/304.
- U.S. EPA (2014). Environmental Quality Index - Overview Report. U.S. Environmental Protection Agency, Washington, DC, EPA/600/R-14/305.
Datasets and Geoprocessing
- Datasets and files from the EQI county data from 2006-2010.
- Interact on an ArcGis map for the Overall Environmental Quality Index (EQI) by County, 2006-2010.
- Datasets and files from the EQI county data from 2000-2005.
- Learn more about the EQI datasets and geoprocessing underpinning the EQI on the U.S. EPA Environmental Quality Index (EQI) and Associated Domain Indices by County 2000-2005.
- Interact on an ArcGis map for the Overall Environmental Quality Index (EQI)by county, 2000-2005
Journal Articles Related to Environmental Quality Index in Support of Human Health
- Krajewski, A., K. Rappazzo, P. Langlois, L. Messer, and D. Lobdell. Associations between cumulative environmental quality and ten selected birth defects in Texas. Birth Defects Research. John Wiley & Sons, Inc., Hoboken, NJ, 113(2):161-172, (2020). https://doi.org/10.1002/bdr2.1788
- Jagai, J., A. Krajewski, S. Shaikh, D. Lobdell, and R. Sargis. Association between environmental quality and diabetes in the U.S.A. Journal of Diabetes Investigation. John Wiley & Sons, Inc., Hoboken, NJ, 11(2):315-324, (2020). https://doi.org/10.1111/jdi.13152
- Kosnik, M., D. Reif, D. Lobdell, T. Astell-Burt, X. Feng, J. Hader, and J. Hoppin. Associations between access to healthcare, environmental quality, and end-stage renal disease survival time: Proportional-hazards models of over 1,000,000 people over 14 years. PLoS ONE . Public Library of Science, San Francisco, CA, 14(3):e0214094, (2019). https://doi.org/10.1371/journal.pone.0214094
- Gray, C., D. Lobdell, K. Rappazzo, Y. Jian, J. Jagai, L. Messer, A. Patel, S. Deflorio-Barker, C. Lyttle, J. Solway, and A. Rzhetsky. Associations between environmental quality and adult asthma prevalence in medical claims data. Environmental Research. Elsevier B.V., Amsterdam, Netherlands, 166:529-536, (2018). https://doi.org/10.1016/j.envres.2018.06.020
- Patel, A., J. Jagai, L. Messer, C. Gray, K. Rappazzo, S. DeflorioBarker, and D. Lobdell. Associations between environmental quality and infant mortality in the United States, 2000-2005. Archives of Public Health. BioMed Central Ltd, London, Uk, 76(60):1, (2018). https://doi.org/10.1186/s13690-018-0306-0
- Gray, C., L. Messer, K. Rappazzo, J. Jagai, S. Grabich, and D. Lobdell. Association between physical inactivity and obesity is modified by five domains of environmental quality in U.S. adults: A cross-sectional study. PLoS ONE . Public Library of Science, San Francisco, CA, 13(8):e0203301, (2018). https://doi.org/10.1371/journal.pone.0203301
- Jian, Y., L. Messer, J. Jagai, K. Rappazzo, C. Gray, S. Grabich, and D. Lobdell. Associations between environmental quality and mortality in the contiguous United States 2000-2005. Environmental Health Perspectives. National Institute of Environmental Health Sciences (NIEHS), Research Triangle Park, NC, 125(3):355-362, (2017). https://ehp.niehs.nih.gov/doi/10.1289/EHP119
- Jagai, J., L. Messer, K. Rappazzo, C. Gray, S. Grabich, and D. Lobdell. County-level cumulative environmental quality associated with cancer incidence. Cancer. John Wiley & Sons Incorporated, New York, NY, 123(15):2901-2908, (2017). https://dx.doi.org/10.1002/cncr.30709
- Grabich, S., K. Rappazzo, C. Gray, J. Jagai, Y. Jian, L. Messer, and D. Lobdell. Additive interaction between heterogeneous environmental quality domains (air, water, land, sociodemographic and built environment) on preterm birth. Frontiers in Public Health. Frontiers, Lausanne, Switzerland, 4:232, (2016). http://dx.doi.org/10.3389/fpubh.2016.00232
- Rappazzo, K., L. Messer, J. Jagai, C. Gray, S. Grabich, and D. Lobdell. Associations between environmental quality and preterm birth in the United States, 2000-2005: a cross-sectional analysis.Environmental Health. Academic Press Incorporated, Orlando, FL, 14(1):50, (2015). https://doi.org/10.1186/s12940-015-0038-3
- Messer, L.C., Jagai, J.S., Rappazzo, K.M., & Lobdell, D.T. (2014). Construction of an environmental quality index for public health research. Environmental Health, 13(1):39. DOI: 10.1186/1476-069X-13-39
- Lobdell, D. T., J. S. Jagai, K. Rappazzo, and L. C. Messer. Data sources for environmental assessment: determining availability, quality and utility. American Journal of Public Health. American Public Health Association, Washington, DC, 101(Supp 1):S277-285, (2011). https://doi.org/10.2105/AJPH.2011.300184
Get the Report

(102 pp, 5 MB, About PDF)
