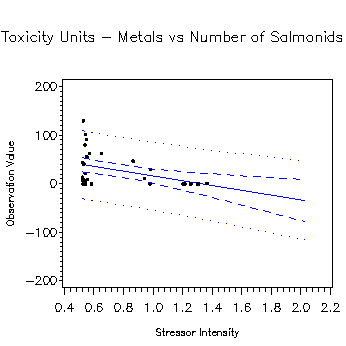
Linear Regression: Number of Salmonids vs. Metal Toxicity Units

Plot
- Analysis: Linear regression
- Independent variable: Metal Toxicity Units
- Dependent variable: Number of salmonids
- Classification variables: none
- Key: dot = observation, solid line = model, dotted line = 95% prediction interval, dashed line = 95% confidence interval
- Sample size: n = 30
Model
- Number of salmonids = 64.367 - 48.763*(Metal Toxicity Units)
- r2 = 0.169
- Date: 12 November, 2006
| Variable | Estimate | t value | p |
|---|---|---|---|
| Intercept | 64.367 | 3.922 | |
| Metal Toxicity Units | -48.763 | -2.387 | 0.024 |
Data Analysis
- Model generated using SAS Proc GLM with the solution option. The grand mean and corrected sums of squares generated with Proc UNIVARIATE for calculating 95% prediction (eq 2.38a) and confidence intervals (eq 2.41) after Kutner et al. 2005.
- Analysis for sites classified as pH neutral, but with strong AMD input.
- Metal Toxicity Units (TU) were calculated as sum of the ratios of each measured metal concentration with the criterion for that metal.
- Replicate visits to a site were not excluded from the data set.
Data Origin
- Agency: U.S. Environmental Protection Agency
- Program: Environmental Monitoring and Assessment Program (EMAP)
- Project: Colorado Metals Belt Stream Assessment (EPA Region 8)
- Filenames: Files benmet, fishmet and chem downloaded from the Surface Waters Information Management (S.W.I.M.S.) database web site
Sampling Design
- Data collected 1994 through 1995.
- Analyzed metals and metalloids: aluminum, arsenic, cadmium, chromium, copper, iron, manganese, nickel, lead, selenium, silver, zinc.
- A description of the sampling methods may be found in the EMAP West Methods Manual for Streams found on the S.W.I.M.S. database web site.
