
2023 EPA Employee Viewpoint Survey Summary
The U.S. Office of Personnel Management administers the Employee Viewpoint Survey, an annual organizational climate survey of the federal workforce to provide agencies a snapshot of how their employees view their current work environment and help inform future agency actions. The U.S. Environmental Protection Agency views EVS results as crucial and ongoing input into our agency-wide human capital planning processes supporting the agency’s mission to protect human health and the environment.
Methodology
OPM administered the 2023 EVS from May 8 through July 7, 2023 to eligible EPA employees (all permanent and temporary employees onboarded as of November 2022). Of the 14,243 surveys administered, 9,226 were completed resulting in a 65% response rate.
Interpretation
OPM included five indices in 2023; four indices from previous survey years and one new index. The agency sustained all-time high scores for the Employee Engagement (79%), Global Satisfaction (75%), and Performance Confidence (91%). The new Employee Experience Index scored 82%, reflecting the way employees internalize and interpret interactions with their organization. The table below shows the EVS index results for 2023.
| 2023 EVS Index | Percentages | Comparison to 2022 Results |
|---|---|---|
|
Employee Engagement Index |
79% | Increase of 1% |
|
Global Satisfaction Index |
75% | Increase of 1% |
|
Performance Confidence Index |
91% | Increase of 1% |
|
Employee Experience Index |
82% |
The Employee Engagement Index measures workforce conditions supporting engagement and comprises 15 items grouped into three subindices: Leaders Lead, Supervisors and Intrinsic Work Experience.
The Global Satisfaction Index combines four items assessing employees’ satisfaction with their job, pay and organization, plus their willingness to recommend their organization as a good place to work.
The Performance Confidence Index combines five items assessing employees’ perception of their work unit’s ability to achieve goals and produce work at a high level.
The Employee Experience Index combines 5 items assessing employees’ interpretation of their interactions with the organization.
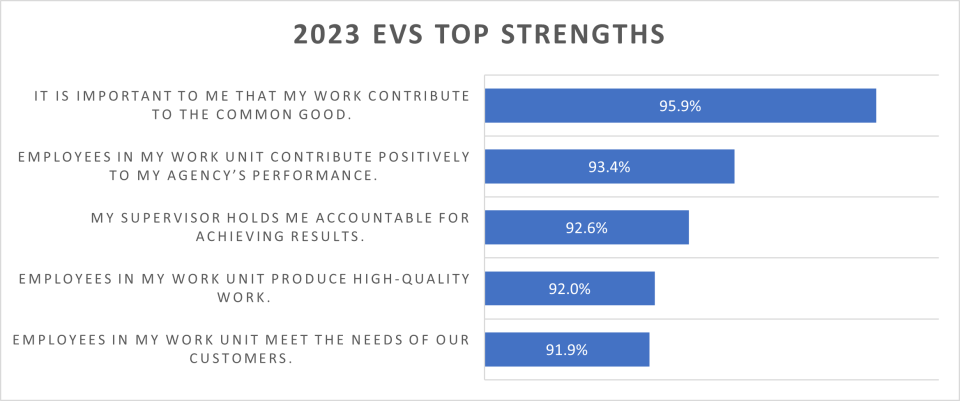
2023 Strengths
OPM defines strengths as those EVS items with a positive response score of 65% or higher (Strongly Agree and Agree on a 5-point Likert scale). EPA results identified 89 strengths from this year’s EVS. The top five strengths are shown below:
- It is important to me that my work contribute to the common good. (95.9%)
- Employees in my work unit contribute positively to my Agency’s performance. (93.4%)
- My supervisor holds me accountable for achieving results. (92.6%)
- Employees in my work unit produce high-quality work. (92.0%)
- Employees in my work unit meet the needs of our customers. (91.9%)
2023 Increases
The items with the largest increases (5.0% or more) in positive responses (Strongly Agree and Agree on a 5-point Likert scale) from 2022 to 2023 include:
| EVS Item | 2023 Score | Change from 2022 |
|---|---|---|
| My organization has prepared me for potential physical security threats. | 72% | +6% |
| My work unit commits resources to develop new ideas (e.g., budget, staff, time, expert support). | 65% | +6% |
| I believe the results of this survey will be used to make my agency a better place to work. | 58% | +5% |
| I can influence decisions in my work unit. | 79% | +5% |
EPA-Specific Items
EPA includes eight agency-specific items in the EVS since 2016. The following table shows the agency-specific items, their respective positive scores (Strongly Agree and Agree on a 5-point Likert scale) for 2023 and the percentage change from 2022.
| Agency-Specific EVS Items | 2023 Positive Score | Change from 2022 |
|---|---|---|
| Managers in my office make effectively managing their people a priority. | 67.7% | +3.2% |
| My office’s top-level management team is aware of the challenges that can affect my work. | 58.8% | +2.5% |
| In my organization, employee feedback is incorporated into supervisors’ annual performance reviews. | 41.1% | +4.2% |
| Senior leaders in my organization actively work to eliminate barriers to productivity that I face in my daily job. | 45.5% | +3.0% |
| In our work culture, people feel free to raise dissenting opinions without it having a negative impact on their careers. | 58.4% | +2.0% |
| My office’s processes have a negative impact on my work output. | 29.3% | +2.0% |
| I have access to the technology I need to do my job effectively. | 79.9% | +1.6% |
| My supervisor supports my career planning and advancement. | 79.1% | +2.0% |