
Analytical Methods and Open Spectral (AMOS) Database User Guide
The Analytical Methods and Open Spectral (AMOS) Database is a web-based application and underlying database developed by the US Environmental Protection Agency (EPA) to provide access to documents associated with different analytical methods (e.g., regulatory, standard operating procedures, lab manuals, and peer-reviewed publications) and a database of spectral data associated with mass spectrometry.
This guide offers step-by-step instructions to help you access AMOS data and features. For additional information or assistance, please contact CCTE@epa.gov.
On this page
- Home Page
- Navigation Bar
- Searching for Substances
- Methods List
- Fact Sheets List
- Analytical QC List
- Similar Structure Search
- Batch Search
- Mass Spectrum Search
- Mass Spectrum Comparison
- Data Sources
- About the Data
- Functional Use Class Visualization
Home Page
The front page of the application is the primary navigation entry point to the rest of the application.
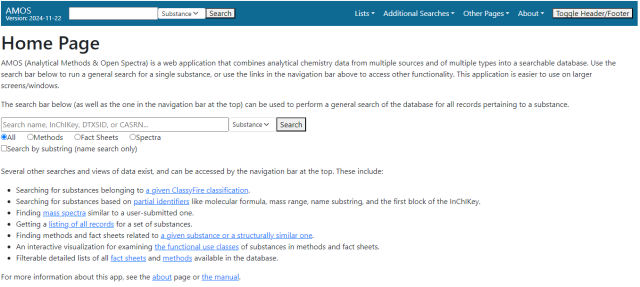
The main functionality on this page is a search box which allows for general searches of the data in the database. Searches can look for either a substance or a specific record by its unique ID in AMOS. Substance searches can be done via compound name, DSSTox Substance Identifier (DTXSID), CAS Registry Number (CASRN), or InChIKey.
To execute the search, enter the relevant identifier, use the dropdown next to the search bar to search by substance or record ID, and either click the “Search” button or hit the Enter key while the cursor is in the entry box to execute a search. If searching by record ID, either the record itself or an error page will be displayed. See the “General Search Results” section for information on the results of substance searches.
There are two modifiers for this search:
- The four radio buttons below the search bar will let you preselect which type of records you want to see when the search results load.
- The “Search by substring” option will redirect you to a page listing all substances with a name (either a preferred name or a known synonym) containing the searched term as a substring. See information on the partial identifier search below.
These modifiers are not available if you run your search using the search field in the top navigation bar.
Normally, the search term is treated as a complete identifier unless the “Search by substring” checkbox is selected. InChIKeys are a partial exception to this – see the section on the general search page for more information.
Navigation Bar
The bar on the top of the AMOS page is the primary method of navigating through the application. It is present on all pages.
The left side of the bar displays the name of the app (hyperlinked to the home page) and the version of the application. Next to it is a search box which will allow for general searches of the data in the database by either compound name, DTXSID, CAS registry number, or InChIKey. This is essentially the same as the main page's search box, with the exception that the additional options available on the front page are not available.
On the right side of the bar is a list of links and dropdowns in the following order. All pages will be described more thoroughly later in the manual.
- Lists: A dropdown menu for pages that list documents in the database. There are currently three lists: a list of spectrum PDFs incorporated from a project called Analytical QC, one for all methods in the database, and one for all fact sheets.
- Additional Searches: A dropdown menu listing other, more specialized searches of data in the database. There are currently five searches available: a batch search for information on multiple DTXSIDs' records, a classification substance search using ClassyFire classifications, a search for comparing a user mass spectrum against those in the database, a partial identifier search that lists substances given an identifier that can match multiple substances, and a page for finding methods that contain either a compound of interest or a highly similar compound.
- Other Pages: This dropdown menu is currently a catch-all for pages that are partially developed or otherwise being updated. There are two pages here: one with a visualization of the analytes present in methods in the database, and one page for doing comparisons of spectra.
- About: A dropdown menu with links to the AMOS about page, support contact information, descriptions of the major data sources used in AMOS, a list of related EPA-built applications, and release notes for updates to AMOS.
On the far-right side, there is also a button labeled "Toggle Header/Footer", which toggles the visibility of the EPA website header and footer elements.
Searching for Substances
The primary identifier used in AMOS is the DSSTox substance identifier (DTXSID). Searches can additionally be run by either substance name, CAS registry number, or InChIKey. Substance names do not need to conform to any particular format (e.g., IUPAC), as the database can identify a large number of synonyms, although common synonyms are more likely to be recognized.
Multiple pages in AMOS perform searches, most of which follow the same basic sequence of events:
- Determine what type of identifier the search term is. If it’s not a DTXSID, try to determine what kind of identifier it is and then compare against the list of known substances in the database. The identifier is assumed to be complete – that is, AMOS looks for an exact match for the searched term – with a partial exception for InChIKeys described later. If a match is found, retrieve its DTXSID.
- Check the database for records containing that DTXSID. Records can correspond to more than one substance, so the same record can appear in multiple different searches.
- Return those records. Exactly which information is returned varies by which page in AMOS is running the search.
By default, searches treat the search term as a complete identifier, so searches will usually return either zero or one substances. There are three exceptions to this:
- If the search is done by the front page and the “Search by substring” box is checked, the page will redirect to a list of all substances where the substring is present in either the preferred name or a synonym. See the section on partial identifier searches for more information.
- If a complete search is done on an InChIKey, AMOS will check for all InChIKeys that start with the same block, and a disambiguation prompt will appear. An exact match to the searched InChIKey is not necessary; if there is one, it will be brought to the top of the list.
- If a complete search is done on a name that is a synonym for multiple compounds but is not an EPA-preferred name for any compound, a disambiguation prompt will appear. (If the search term is an EPA-preferred name, then even if it is a synonym for other substances, the search will always go to that substance.)
General Search Results
The search results for a single substance consists of three main parts: a description of the substance on the top left, a table of the results on the bottom left, and a viewer on the right side of the page.
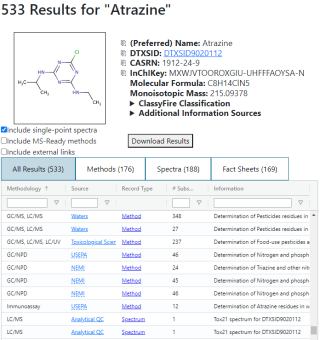
The substance description includes a few common identifiers, basic physical information about the substance, an image of the structure, if available, and the top four levels of the substance's ClassyFire classification. If there are additional sources that could have useful information beyond AMOS’s focus, a collapsible element will appear listing those. Icons to the left of the preferred name, DTXSID, CASRN, and InChIKey are buttons to copy the corresponding field to the clipboard.
The database records are shown in a table below the substance description. These records are filterable by the analytical methodology or methodologies they use, the source of the record (including a hyperlink to the original source, if possible), or some information about the record. The type of records being shown can be toggled using the tab bar just above the table; selecting a tab will hide and show different columns depending on what is applicable or relevant for each data type.
The contents of the table can be filtered using the checkboxes below the substance info:
- “Display Single-Point Spectra” toggles the display of mass spectra that only contain one point.
- “Include MS-Ready Methods” will add methods that contain variations of the searched substance. MS-Ready substances are ones that are variations on the same basic substance, where those variations may be salts, isotopes, or stereoisomers, among other things. These are determined by matches to the first block of the InChIKey. The first time this is selected, an additional call is made for those methods, so there may be a slight delay in them appearing in the results.
- “Include external links” will show links to spectra that are not allowed to be stored in AMOS, but are accessible to users of the respective sources. This is normally unchecked by default, but if the only records for a substance are from external links, it will be checked when the results are displayed.
Mass Spectrum Viewer
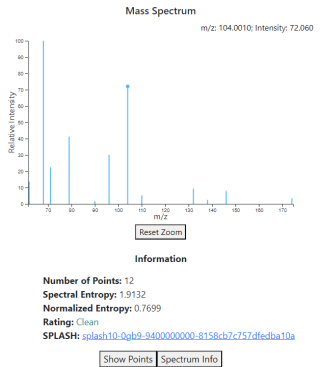
When a mass spectrum that is stored directly in the database is selected, the right side will change to show a plot of the spectrum (see image right), alongside some information about the spectrum. The plot can be interacted with by hovering your cursor over the plot; the peak in the spectrum closest to the cursor will have its information shown in the top right corner of the plot.
The buttons at the bottom can be used to view either the spectrum in tabular form, or the metadata associated with the spectrum. The latter button will only appear if any metadata for the spectrum is available.
Metadata quantity and quality vary a great deal across spectra, as different sources have different standards for what they include. In general, the spectrum metadata is heavily focused on the instrumentation and other aspects of the setup used to collect the spectrum, and is divided along the lines of chromatography versus spectrometry.
NMR & IR Spectrum Viewers
If an NMR or IR spectrum in the database is selected, a display similar to the one for mass spectra will appear, including a plot of the spectrum and some additional information underneath.
NMR and IR spectra are relatively recent inclusions into the database, and relatively little metadata is being collected for the moment. Any metadata that is available for the spectrum is shown directly in the viewer, as opposed to a modal window like the mass spectrum metadata.
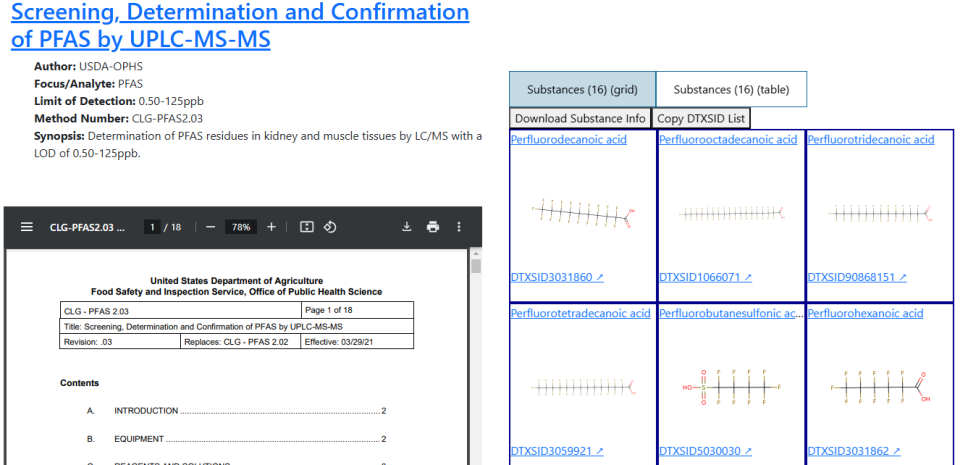
PDF Viewer
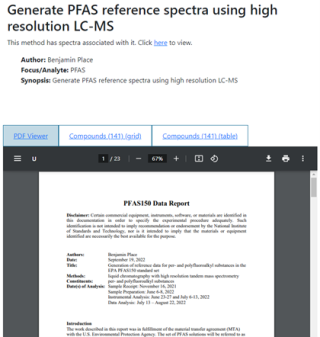
When a method, fact sheet, or PDF of a spectrum is selected, the right side of the page will list the name of the document, some metadata (if possible), and a tabbed viewer that allows the user to go between the document itself and lists of the substances that appear in that document in either a table or a grid layout.
If the document is open-access, then it will be displayed in the PDF viewer. If it is not (e.g., if it’s behind a paywall) then a dummy document containing an abstract and links to where to find it will be shown instead.
If a method has spectra associated with it, a note will appear in the description on top which will include a link to a page where the method and its associated spectra can be viewed side-by-side.
Partial Identifier Search
The partial identifier search is a page for searching for substances by identifiers that are not unique to a substance. Four search options exist for this: substrings in the substance name or synonyms, the first block of the InChIKey, a range of monoisotopic masses, and an exact molecular formula in Hill form.
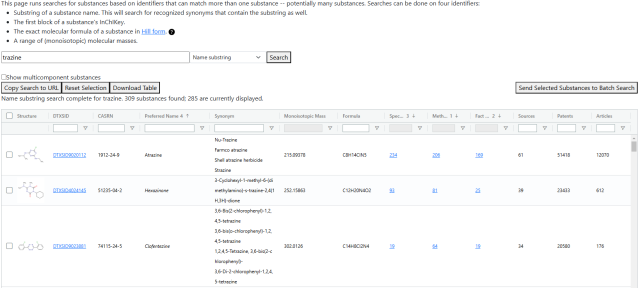
Along with the names, the table includes other substance identifiers (including synonyms if a name substring search is run), information on the number of records in the database, and counts of how many times the substance appears in patents, articles, and other external sources. The default sorting on the table tries to show the substances with the most data first.
The "Show Multicomponent Substances" checkbox will toggle whether recognized substances that combinations of more than one chemical are shown.
The four buttons below the search bar have the following functionality:
- "Copy Search to URL": Copies a URL to the browser clipboard that links to the page and will repeat the current search.
- "Reset Selection": Resets the contents of the search bar.
- "Download Table": Downloads the full contents of the table to an Excel workbook.
- "Send Selected Substances to Batch Search": Opens a new tab to the batch search, prepopulated with a list of checked substances (using the checkboxes on the left edge of the table's rows). If trying to pass a large number of substances -- hundreds or more -- it may fail to pass all of them due to how some browsers interpret URL query parameters, so it is recommended to not pass more than a few dozen.
ClassyFire Classification Search
This search looks for substances by the top four levels of their ClassyFire classification.
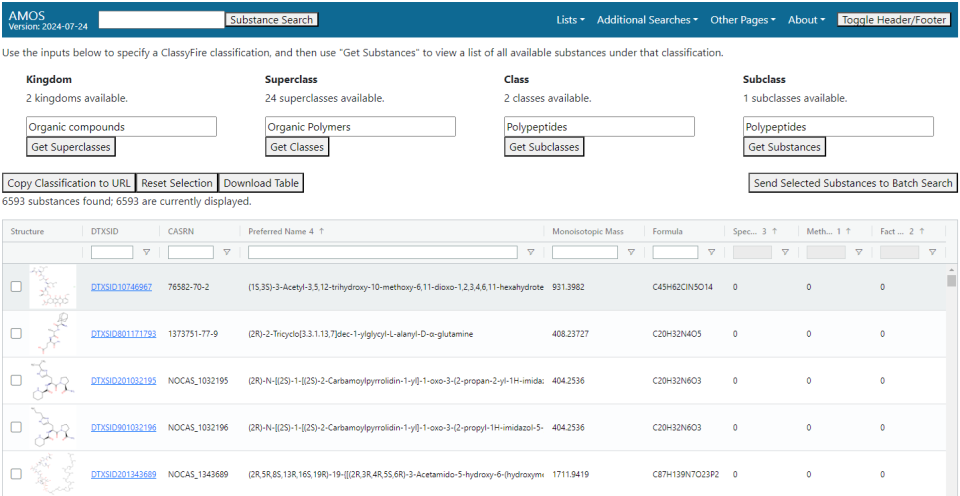
Classification levels are put in one at a time (kingdom, superclass, class, and subclass in that order), with the option of picking the next one available only after the search on the given level is done. Options will pop up in a selectable list when the corresponding text box is selected, or a search of the available values can be done by typing in the box. Once all four levels have been selected, the "Get Substances" button can be used to get a list of substances that fit that classification. If you want to save the search, the "Copy Classification to URL" will copy to clipboard the page URL with parameters that will rerun the search when that URL is loaded.
Filtering on identifiers and physical characteristics can be done using the white boxes at the top of each column. The three columns listing the number of spectra, methods, and fact sheets in the database for a substance have a custom filter that allows the viewing of all records, only those with at least one record of that type, or those without any records of that type.
The four buttons below the search bar have the following functionality:
- "Copy Search to URL": Copies a URL to the browser clipboard that links to the page and will repeat the current search.
- "Reset Selection": Resets the contents of the search bar.
- "Download Table": Downloads the full contents of the table to an Excel workbook.
- "Send Selected Substances to Batch Search": Opens a new tab to the batch search, prepopulated with a list of checked substances (using the checkboxes on the left edge of the table's rows). If trying to pass a large number of substances -- hundreds or more -- it may fail to pass all of them due to how some browsers interpret URL query parameters, so it is recommended to not pass more than a few dozen.
Some subclasses may have several thousand substances under them, so it is possible that this search will be slow.
Methods List
The methods list page displays a table listing all methods present in the database and several fields describing their contents.
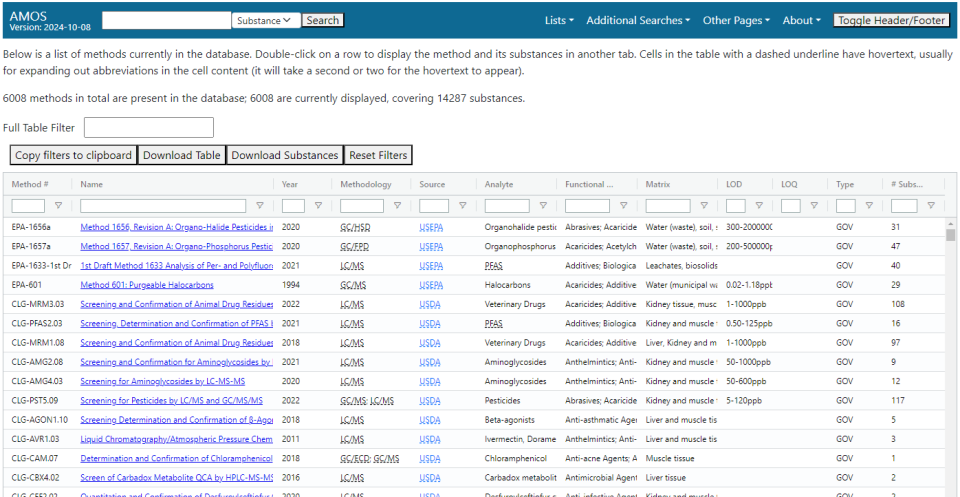
Fields
Individual fields can be hidden or unhidden by clicking on a name in the top row and then checking or unchecking the box next to the field name. The fields present in the table are:
- Method #: An identification number for the method. These are generated by the sources of the documents rather than the EPA, so their formats vary a great deal.
- Name: The name of the method.
- Year: The year the method was published.
- Methodology: The analytical methodologies that are present in the method. They are semicolon delimited.
- Source: The origin of the method.
- Analyte: One or more relatively specific categories of substances that the method focuses on. These are defined by the EPA’s curation team.
- Chemical Class: One or more broad categories of substances that the method focuses on. These are defined by the EPA’s curation team.
- Matrix: The physical matrix where the sample or samples were taken from.
- LOD: Limits of detection specified in the method. These limits are generally across all substances in the method.
- LOQ: Limits of quantitation for the method. These limits are generally across all substances in the method.
- Type: The kind of method.
- #: The number of substances appearing in the method.
- Author: Names of the authors on the method. Hidden by default.
- Publisher: Publisher of the method. Exists for methods published in academic journals (the specific journals themselves are usually the value of “Source”), but generally not others. Hidden by default.
Filters
Filters are present on all fields (except the substance count) that can be used to quickly find subsets of methods that are of interest. Except for the year field and the full table filter, all filters perform substring searches on their respective fields and will update the view of the table if typing is paused for a moment. Filters are combined, meaning that searching for, e.g., ‘GC/MS’ as a methodology and ‘pesticides’ as the analyte will only show methods that fit both criteria.
The full table filter at the top will search for the typed value in all fields and will return all methods where the term appears in any field. This includes fields that are currently hidden.
Button Functions
The four buttons just below the full table filter are:
- “Copy filters to clipboard” copies a URL to the clipboard with the filtered values currently included in query parameters in the URL. If the page is called with those query parameters, the corresponding search fields will be pre-filled. (Note: Currently, including the Year field in the query parameters will only correctly filter searches looking for a specific year.)
- “Download Table” will prompt the download of an Excel file containing the information in the table. If the data has been filtered, only the records visible after the filters have been applied will be present in the downloaded files.
- “Download Substances” will prompt the download of an Excel file containing a list of all substances for visible methods (i.e., methods that pass any filters in place).
- “Reset Filters” will clear the full table filter and all individual filters in the table.
If you want to view a method, double click the row and a viewer will open in a new browser tab. This viewer will have the method itself on one side of the page and lists of the substances it contains on the other side.
Note: The addition of new methods sometimes outpaces how quickly their supplemental information is curated. As such, you may find methods with some blank fields.
Fact Sheets List
The fact sheets list page displays a table listing an assortment of non-method documents in the database, including some basic information about them. Double-clicking a row in the table will display the fact sheet in a new tab.
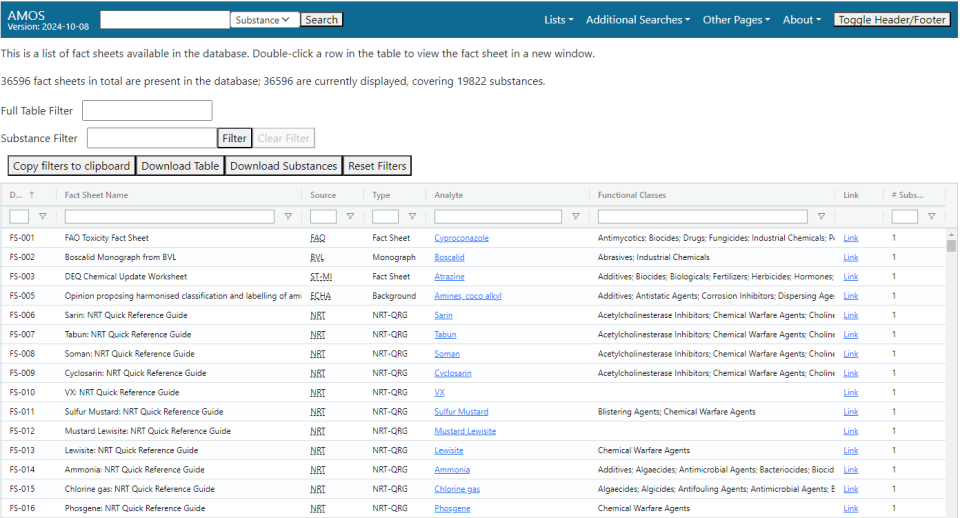
Fields
The fields available are:
- Doc ID: An EPA-generated identifier for the fact sheet.
- Fact Sheet Name: The name of the fact sheet.
- Source: The origin of the fact sheet.
- Type: The type of fact sheet.
- Analyte: The name of the substance or a category of substances that appear in the method. If only one substance appears in the fact sheet, this field will be hyperlinked to the general search for that substance.
- Functional Classes: A list of functional use classes for the substance(s) described in the fact sheet.
- Link: A hyperlink to the source.
- # Substances: Number of substances that appear in the fact sheet.
Filters
There are multiple filters available to allow you to see subsets of the results. The fact sheet name, source, and analyte have their own text filters, and there is also a full table filter above them which will filter out records that do not have the searched term in any field in the table. The full table filter at the top will search for the typed value in all fields and will return all fact sheets where the term appears in any field. This includes columns that may be hidden at the time.
The substance filter takes a name, InChIKey, CASRN, or DTXSID, and if a substance is located, it will filter and display only fact sheets containing that substance. Only one substance can be searched on at a time, and the search must be cleared with the "Clear Filter" button before inputting a new substance.
Button Functions
The four buttons just below the full table filter are:
- “Copy filters to clipboard” copies a URL to the clipboard with the filtered values currently included in query parameters in the URL. If the page is called with those query parameters, the corresponding search fields will be pre-filled.
- “Download Table” will prompt the download of an Excel file containing the information in the table. If the data has been filtered, only the records visible after the filters have been applied will be present in the downloaded files.
- “Download Substances” will prompt the download of an Excel file containing a list of all substances for visible fact sheets (i.e., methods that pass any filters in place).
- “Reset Filters” will clear the full table filter and all individual filters in the table.
Note: The addition of new fact sheets sometimes outpaces how quickly some of their supplemental information is curated. As such, you may find fact sheets that have not been fully curated yet.
Analytical QC List
This page displays a subset of spectra stored in PDFs from the Analytical QC project, an EPA project which collected experimental data and expert assessments of toxicity for approximately 10,000 substances of interest. There is a dedicated Analytical QC application which contains more detailed results of the project, but the spectra are useful enough on their own to warrant inclusion in AMOS.
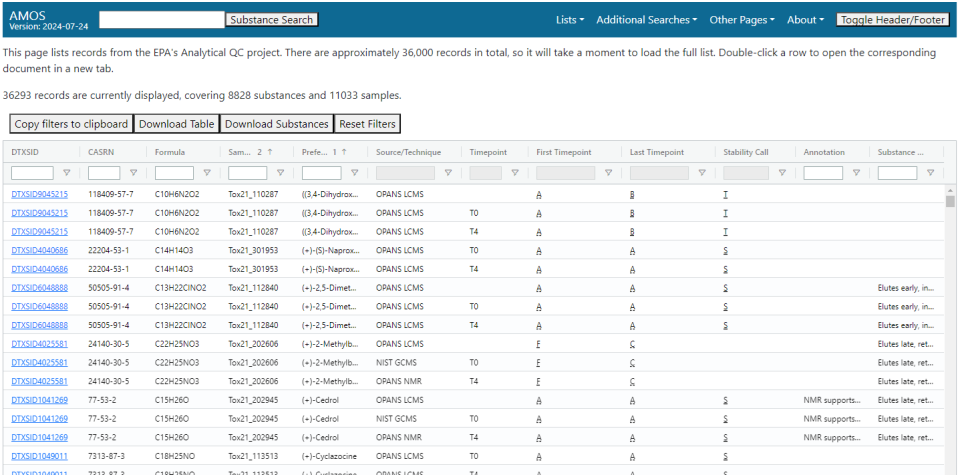
Fields
The fields available are:
- DTXSID: The DTXSID of the substance concerned.
- CASRN: The CAS registry number of the substance concerned.
- Formula: The molecular formula of the substance.
- Sample ID: ID for the sample. Multiple samples per substance may exist, and multiple records may be measurements of the same sample.
- Preferred Name: The EPA-preferred name of the substance concerned.
- Source/Technique: Brief description of who ran the sample and the methodology they used. Defaults to filtering out certain GC/MS records.
- Timepoint: Timepoint at which the experiment described in the record was run.
- First Timepoint: Expert assessment of the sample quality at the start of the experiment. These are defined at a sample level.
- Last Timepoint: Expert assessment of the sample quality at the end of the experiment. These are defined at a sample level, and can differ from the assessment at the first timepoint due to, for instance, dissociation of the substance in water or whatever medium it is stored in.
- Stability Call: Expert assessment of the overall stability of the substance in the experiment.
- Annotation: Additional notes or context about the spectrum that may be of use.
- Substance Flags: Notes or considerations about the substance examined in the document.
- Experiment Date: Date of the experiment in YYYY-MM-DD format. Hidden by default.
Filters
Several filters in the table allow for subsets of the data to be easily found. Filters on the DTXSID, CASRN, and preferred name fields are for filtering by substance, with additional filtering possible on other fields.
Similar Structure Search
The similar structure search is a page which locates methods and fact sheets containing either a searched substance or a substance that is highly structurally similar to the searched one. The primary purpose is to provide a broad set of possible analytical ideas and techniques for any given substance, especially for substances that have few or no methods available, since similar – potentially very similar – substances may have been analyzed, and those analyses can serve as a good starting point, if not a full solution.
To run a search, input a DTXSID, CASRN, InChIKey, or substance name into the search bar at the top of the page. The search will locate all known substances with a Tanimoto similarity of at least 0.5, locate all methods and fact sheets containing at least one of those substances (including the searched substance), and then return all of that information for viewing. Searched substances do have to be recognized by the EPA, but it is not necessary that there are any data records in the database concerning that substance.
The "Filter minimum substance similarity" control will adjust which results are visible to the user but does not change the underlying search.
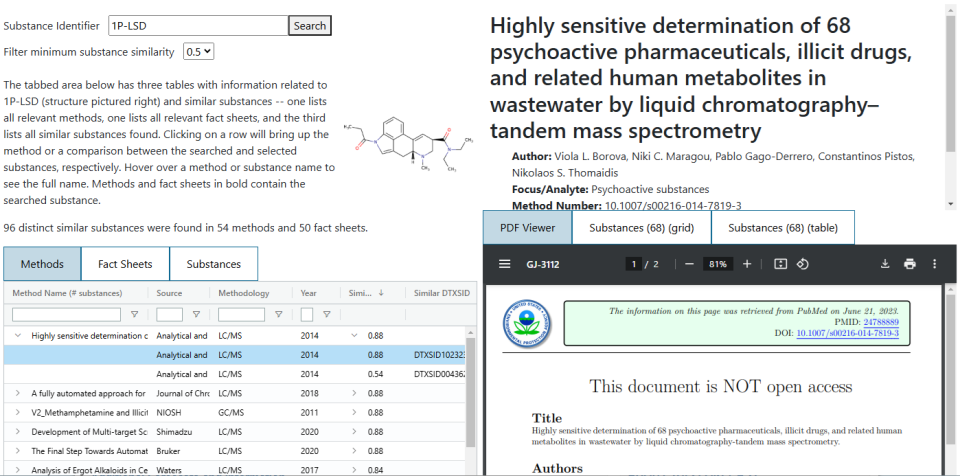
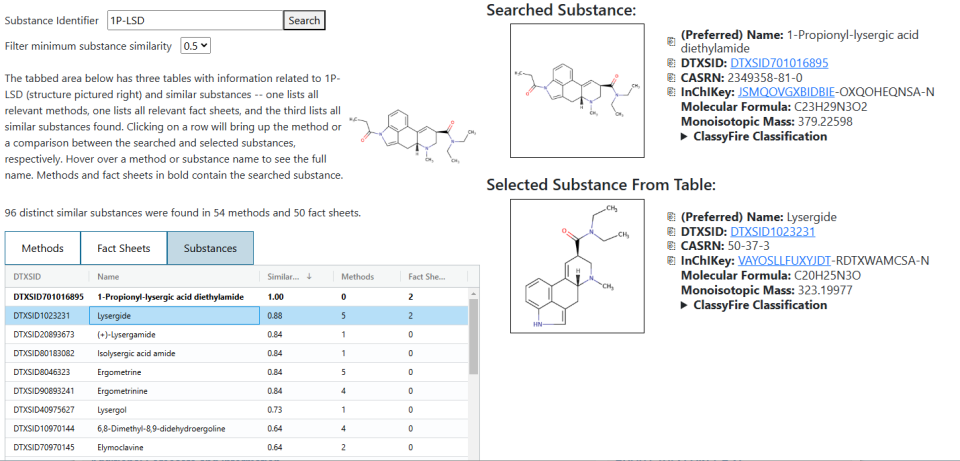
Once the search is complete and results have been returned, there will be three tabs, each with a separate table underneath. The first two tables list the methods and fact sheets found in the search. There is a dropdown that can be used to see the list of similar substances found in that document and clicking on a row will bring up a document viewer on the right side of the page. Selecting either of the “Substances” tabs in this viewer will return a basic list of all of the substances that appear in the document (not just the highly similar ones). The similar substances are given a light blue background to highlight them.
The third tab allows for viewing the list of similar substances. Selecting a row in this table will bring up a simple comparison between the searched substance and the one selected in the table.
Batch Search
The batch search is a page for retrieving information about records for multiple DTXSIDs at once. If the DTXSIDs are not known but other identifiers are, the page has a link to the substance search on the CompTox Chemicals Dashboard, which can supply the DTXSIDs for the substances.
When the search is complete, an Excel file will download. This file has two sheets in it – one that lists the counts of records by substance, and one that contains information on the individual records. The individual records’ information is largely similar to the results of the general search, containing things like links to the original source, record types, methodologies, etc.
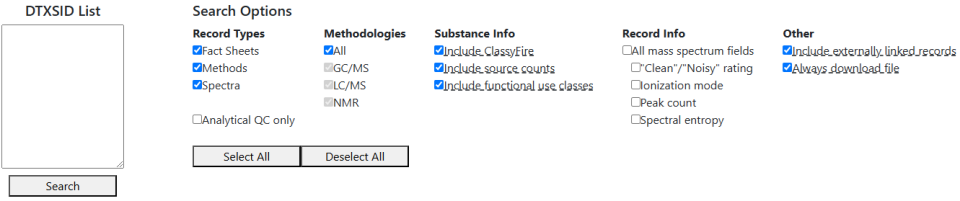
Additional options for the search are:
- "Record Types": Filters records by data type. The "Analytical QC only" option overrides and locks the other options, as it refers to only a particular subset of spectra.
- "Methodologies": Filters records by the analytical methodologies present in the record. If 'All' is not selected, records that do not contain GC/MS, LC/MS, or NMR data -- such as most fact sheets (which lack a methodology) or methods focused on immunoassay work -- will not be included under any circumstance.
- "Substance Info": Three options for: toggling whether to include a substance's ClassyFire classification, if available; whether to include counts of references to a substance in external sources; and whether to include the functional use classes for substances. This is substance-level information that goes in the first sheet, unlike the other options.
- "Record Info": Options for various other metadata to include. It is currently limited to several options that apply only to mass spectra -- a rating of spectrum quality, the ionization mode, the number of peaks, and the spectral entropy.
- "Other": Options that don't fit the previous groupings. Currently has two options for choosing whether to include records that are only externally linked and choosing whether a result file should be downloaded even if no records were found in the database for the list of DTXSIDs.
Selecting or deselecting most of these options can be done with the "Select All" and "Deselect All" buttons below the options themselves.
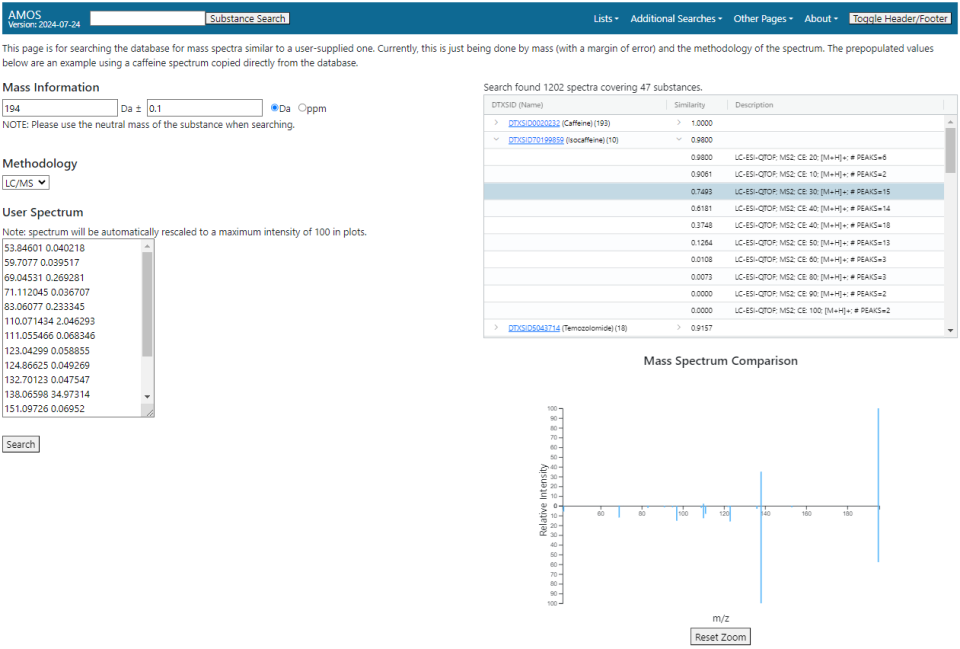
Mass Spectrum Search
The spectrum search page allows for searching the database for all spectra corresponding to a mass range and methodology and compare them to a user-supplied spectrum.
To run a search, four pieces of information must be supplied:
- A range for the monoisotopic mass. The center of the range is specified in Daltons while the size of the window can be specified in either Daltons (up to 0.5) or parts per million (up to 25).
- A mass window for determining similarity between peaks. The default is 0.05 Da.
- An analytical methodology. Currently just supports GC/MS and LC/MS (positive and negative LC/MS are currently not distinguished between).
- A user-supplied spectrum that is compared against the database spectra. This spectrum should be formatted as a list of m/z-intensity pairs, one pair per line, with the m/z and intensity values separated by whitespace.
When the search is complete, a table listing all found spectra will appear. Spectra are grouped by substance and sorted by the entropy similarity between the user-supplied spectrum and the database spectrum. Using the drop-down arrows in the table, the individual spectra from the database can be seen in comparison to the user-supplied spectrum. The numeric control just above the table will hide spectra that are below a certain similarity, with a minimum value of 0.1.
Selecting a row in the table will bring up a simple mirror plot below displaying both spectra, with the user-supplied spectrum in light blue on top and the database spectrum on orange on the bottom. Peaks between the two spectra that fall in the mass window specified in the search will all be colored with a darker blue.
Mass Spectrum Comparison
The spectrum comparison page is used for comparing a user-supplied spectrum to another user spectrum or some spectra in the database.
In normal operation, the spectrum comparison page will show two input fields. Each one will accept a spectrum in the form of rows of text, with each row consisting of one m/z-intensity pair with the values separated by a single space. Using the buttons below the spectra, one can look at either spectrum individually or both at the same time. Calculations of spectral entropy (for individual spectra) or entropy similarity (for both spectra) will appear below the plot.
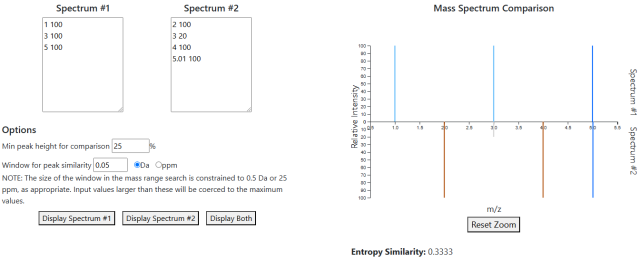
A second mode of operation can be enabled by supplying a list of DTXSIDs as a query parameter in the URL. In this instance, the second box will be replaced by a table listing all spectra in the database for all of the supplied DTXSIDs. The functionality of the page is otherwise the same, except that you must select a row in the table to view the database spectrum.
Two controls on the page affect how the mirrored two-spectrum plot is displayed:
- A minimum peak height can be set for consideration. Peaks below this threshold are not considered in the entropy similarity calculation and are greyed out in the plot.
- The size of the window for peaks to be considered similar can be adjusted. Similar peaks in the plot are colored in a darker blue.
Data Sources Page
This page lists many of the data sources that have records in AMOS’s database. The information listed includes a rough category of source, a brief description, and a tally of the records in the database from that source.
The exact definition of “source” varies somewhat within the database. Most of the spectra in the database come from sources which are aggregating spectra generated by many separate groups – MassBank EU is a good example, as it organizes the spectra in its data dumps by the group or other organization that submitted the spectra, of which there are technically over 50, but all are listed as coming from MassBank EU in AMOS. Methods and fact sheets, on the other hand, often have the original organization that wrote the document as the source (though many methods that have been published in journals use the name of the journal instead).
Not every source in the database is listed on this page, as listing every single one would take up a great deal of space given that there are currently over 200 unique sources. Currently, as a rough heuristic, a source is listed if it contributes 40 methods or 100 total records (fact sheets, spectra, and/or methods).
Additionally, some individually listed sources in the database are grouped together if they are projects or work by some group within an organization. For instance, the listing for the EPA in the table includes data from mass spectrometry labs, a project called the Environmental Chemistry Methods Index, and from groups such as the Office of Water.
About the Data
The records stored in AMOS consists of three categories:
- Spectra: Spectra of various kinds, some of which are stored in the database and some of which are just externally linked to. Spectra stored directly in the database are predominantly mass spectra, with smaller amounts of NMR and IR; a small amount of these spectra are stored as PDFs rather than the actual numeric spectrum.
- Analytical methods: Descriptions full analytical procedures for analyzing one or (often) a group of substances in a given context. These include information sample preparation, analytical methodologies, and the environment that the sample was taken from.
- Fact sheets: A broad category of supplemental documents. These can range from basic information sheets on a substance to monographs detailing the results of an analysis.
Up-to-date counts of the records in the database can be seen on the "About this App" page.
All records in AMOS can have additional metadata. The possible contents of the metadata will be dependent on the type of record and how much information could be extracted from either the records themselves or additional context provided by the source (e.g., descriptions of a spectral library on the website where it can be downloaded).
Records in AMOS are largely, but not fully, open access. Spectra that are externally linked are generally behind login prompts, but are otherwise accessible by anyone. Methods and fact sheets that are not present in the database will have dummy documents that summarize the document and link to the source; these documents are usually from journals that require paid subscriptions, however, so accessing the originals may not be an option.
Because the data is amalgamated from a variety of sources, data quality can and will vary a great deal within the database. Efforts are made to curate the data as well as is reasonable to do so, but the sheer quantity of data and the sometimes-low-quality identifiers or metadata that come with it mean that it is not plausible to perfectly curate all data.
Functional Use Class Visualization
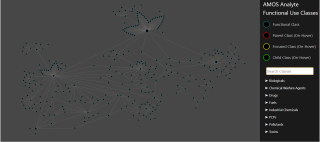
This page displays a D3-based visualization of the functional use classes for substances in the database. Functional use classes are curated categories that describe typical uses of a substance with varying levels of specificity, many of which are parent or child categories of others. For example, "psychotropics" is a child class of "drugs" but also a parent to "antidepressants" and "hallucinogens" (among others).
The left side represents the hierarchy of use classes as a directed graph. Individual nodes can be hovered over to get a brief description of the analyte class, as well as highlighting any parent or child classes. The display can be zoomed in and out as needed.
The search field on the right side will search a list of the analyte classes. Hovering over the name in the list will highlight the corresponding node in the visualization.
Right-clicking on either an individual node or a name under the search results will open an element that lets you see either the methods list or the fact sheets list with the “Functional Classes” filter pre-populated with the value you clicked on.
A demo video displaying the capabilities of the visualization is available here.