
Climate and Weather Data Maps
The maps below translate complex climate and environmental data into usable formats for water sector utilities. They help utilities understand their climate risks through a variety of data; including Climate Projection Data and Historical Environmental Data.
Data Access Page: Download data from the maps below for your own analysis.
Climate Projection Data
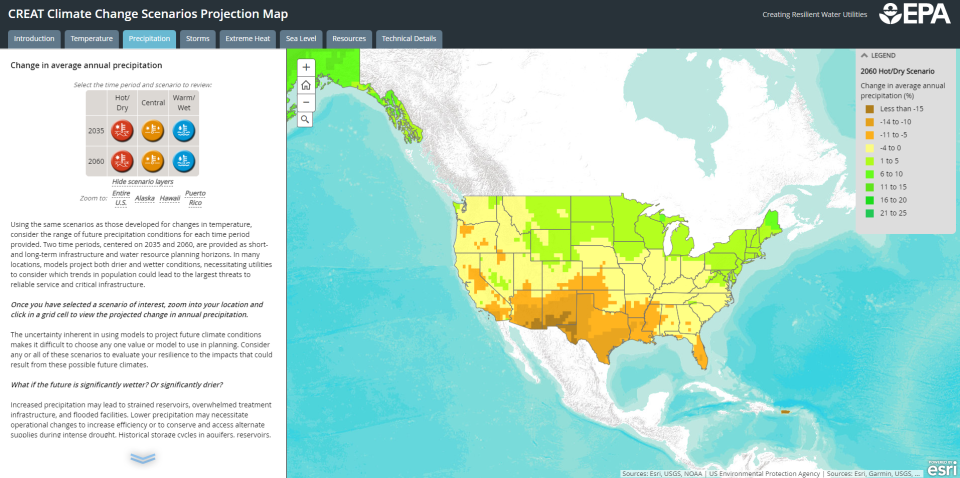
Climate Scenarios Projection Maps:
View scenario-based climate projections for temperature, precipitation, extreme storms, extreme heat, and sea level rise and assess the potential climate change impacts on your utility.
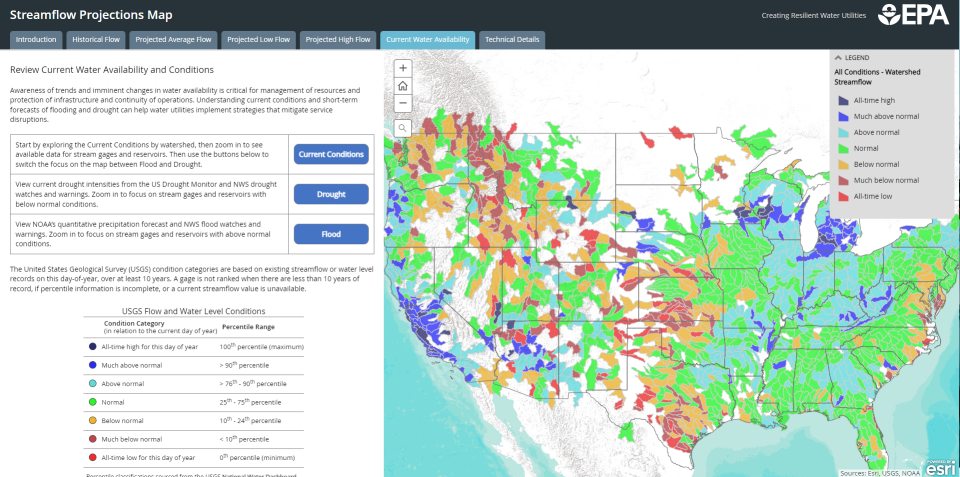
Explore historical and projected changes in flow conditions for U.S. streams and rivers as well as the status of stream gages and reservoirs.
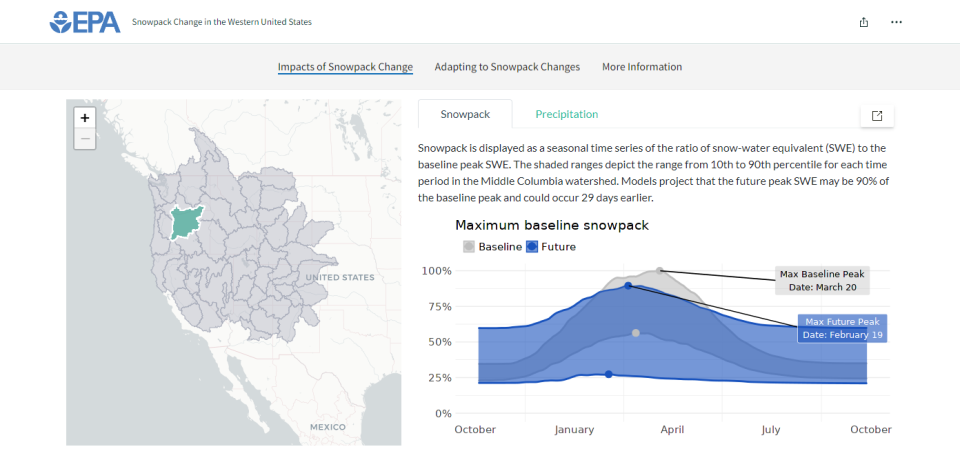
Snowpack Change for the Western United States StoryMap:
Explore the connection between climate change and changing snowpack resources to assist utility adaptation efforts.
Historical Environmental Data
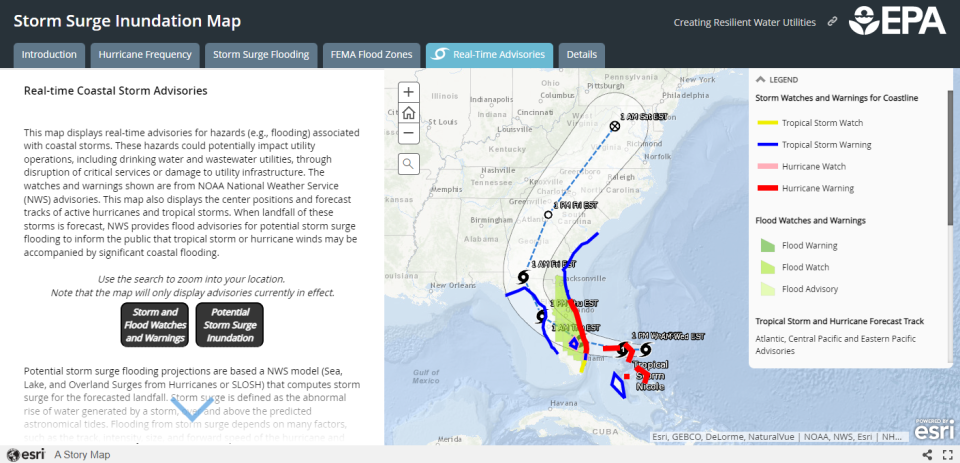
Storm Surge Inundation and Hurricane Strike Frequency Map:
View historical coastal storm surge and hurricane data to mitigate flood damage to your utility.
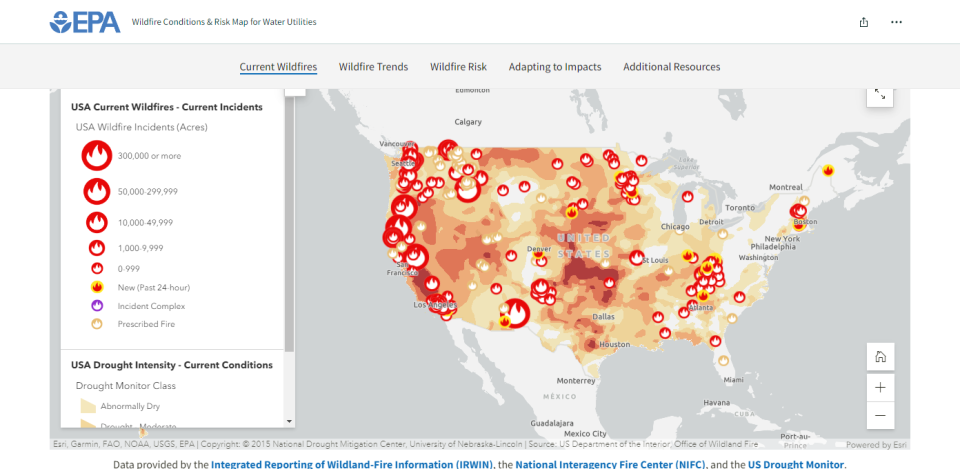
Wildfire Conditions and Risk for Water Utilities StoryMap:
Explore current wildfires, historical wildfire trends, and community risk to wildfire across the US including Alaska and Hawaii.
Connect With Us
- Sign up: CRWU News
- Email us: crwuhelp@epa.gov