
Interim Results for SARS-CoV-2 Surface Disinfection with UV-March 1, 2021
Experimental Approach
A standard EPA-approved method does not currently exist for the testing of UV light-generating devices for efficacy (ability to kill or inactivate the target pathogen) against viruses on surfaces. A standardizable approach was developed in this current effort through incorporation of elements of ASTM E3135, Standard Practice for Determining Antimicrobial Efficacy of Ultraviolet Germicidal Irradiation Against Microorganisms on Carriers with Simulated Soil[1].
This UV research was conducted with SARS-CoV-2 as well as two potential surrogate viruses for SARS-CoV-2, namely bacteriophages MS2 (non-enveloped virus) and Phi6 (enveloped virus) (see Table 1). Results from bacteriophage disinfection studies were used to guide the exposure conditions for the SARS-CoV-2 laboratory tests and support larger-scale and field testing of UV devices.
Table 1: Virus Types used in the UV disinfection Research
|
Virus |
Description |
Virus Host |
Analysis Method |
Inoculum |
|
MS2 (ATCC 15597-B1) |
Non-enveloped virus; bacteriophage |
Escherichia coli |
Plaque assay, E. coli C-3000 (ATCC 15597) |
5% Fetal Bovine Serum; spread on surface |
|
Phi6 |
Enveloped virus; bacteriophage |
Pseudomonas syringae |
Plaque assay, P. syringae LM2489 |
5% Fetal Bovine Serum; spread on surface |
|
SARS-CoV-2 Isolate USAWAl/ 2020 (BEI NR-52281) |
Enveloped virus; human beta coronavirus |
Human; Vero cells (ATCC CCL-81) |
TCID50; RT-qPCR on subset |
5% Fetal Bovine Serum and simulated saliva; droplets (no spreading) |
Uniform pieces of surface material (referred to as coupons) were prepared, cleaned, rinsed, and sterilized. The target virus was inoculated onto these coupons. Test coupons were either exposed to UV light immediately (i.e., wet inoculum) or after a period (typically one hour) to allow the inoculum to dry. Positive controls for each test condition were inoculated on the same material and not exposed to the UV light. All test and positive control coupons were run in triplicate. Negative controls (not inoculated but exposed to UV light) were also included. Material types tested include 301 milled-finish stainless steel, ABS plastic, and bus seat fabric for the SARS CoV-2 tests. Glass and 304 brushed stainless steel, as well as the 301 milled-finish stainless steel and ABS plastic, were included in the MS2 and Phi6 studies.
UVC-emitting light sources were identified with stakeholder input from Los Angeles County Metropolitan Transportation Authority (LA Metro). They considered a light emitting diode (LED) and a pulsed xenon light as two UV light emitting devices of interest. While the LED emits a discrete UVC wavelength continuously, the pulsed xenon light source generates a high intensity broad spectrum UV light from 220 nm to 400 nm and into the visible wavelengths with a pulse frequency of one pulse every six seconds. This second interim report details additional UVC research that was conducted with the pulsed xenon light source following the release of the first interim report (November 10, 2020) and new disinfection research that utilized the LED as the light source.Uniform pieces of surface material (referred to as coupons) were prepared, cleaned, rinsed, and sterilized. The target virus was inoculated onto these coupons. Test coupons were either exposed to UV light immediately (i.e., wet inoculum) or after a period (typically one hour) to allow the inoculum to dry. Positive controls for each test condition were inoculated on the same material and not exposed to the UV light. All test and positive control coupons were run in triplicate. Negative controls (not inoculated but exposed to UV light) were also included. Material types tested include 301 milled-finish stainless steel, ABS plastic, and bus seat fabric for the SARS CoV-2 tests. Glass and 304 brushed stainless steel, as well as the 301 milled-finish stainless steel and ABS plastic, were included in the MS2 and Phi6 studies.
Material coupons were placed flat on a table, with the surface facing the light source above the table at various distances (0.15 m – 2.0 m) and with exposures to the light for durations ranging from 3.75 - 60 minutes.
Prior to the start of the bench scale disinfection testing, LA Metro conducted a field test in an empty metro car to evaluate the feasibility of using the pulse xenon light sources in their nightly routine cleaning and disinfection practices. As part of this field test, LA Metro recorded UV light doses using UV light sensors in selected areas of interest for a variety of test conditions with changing light configurations and exposure durations. Reported UV doses (adjusted to report only the UVC component of the emitted light) were 0.15 to 3.5 mJ/cm2, depending on distance from the sensor to the pulsed xenon light (at a minimum 60 inches), exposure time (30 min or shorter), number of lights present, and whether the sensor was in a direct line of sight or an obscured area.
Results March 1, 2021
SARS-CoV-2 Virus Research
Sterile ABS plastic, bus seat material (pile: 85% wool, 15% nylon) and 301 stainless steel coupons (1.9 cm x 7.6 cm) were inoculated with SARS-CoV-2 isolate USAWAl/2020 (BEI NR-52281) in storage media (MEM + PenStrep + 5% FBS) or in simulated saliva[2]. Virus was inoculated onto each coupon material, without dilution, as a series of smaller droplets without spreading. A 100 microliter (μL) inoculum was added as 10 by 10 μL droplets. The simulated saliva formulation is a solution designed to mimic the properties of saliva (e.g., pH, protein content, tonicity). Both inoculums had a target concentration of ~2 x 10⁶ Median Tissue Culture Infectious Dose (TCID50) /mL. After exposure to UV light, viable virus was recovered from coupons by adding 10 mL of extraction buffer (e.g., cell culture media) to each tube containing the test samples and associated blanks. The tubes were agitated on an orbital shaker for 15 min at approximately 200 rpm at room temperature. Eluents were tested for viable virus by cell culture (TCID50). Virus concentrations in the eluent were determined and compared to inoculum concentration to determine extraction efficiency. Extraction and recovery of infectious virus was assessed immediately after inoculation and after drying on the surface. The efficacy (log reduction) was calculated by the difference in mean log10 recoveries of positive control samples (samples not exposed to UV light) and of UV-exposed samples. Recoveries of SARS-CoV-2 in simulated saliva (only) from coupons that were not exposed to UV light (positive controls) were just above 2 x 10³ PFU/coupon which, in combination with the limit of detection (6 PFU/coupon), did not allow for a demonstration of a 3 log reduction.
SARS-CoV-2 inactivation data with the pulsed xenon light source are summarized in Figure 1. Reported data include log reduction for different UVC doses, three materials; for inoculum that was dry or wet at the start of the UV exposure; and for the SARS-CoV-2 virus in tissue culture media or in simulated saliva. Viable virus was recovered from test coupons unless marked in Figure 1.
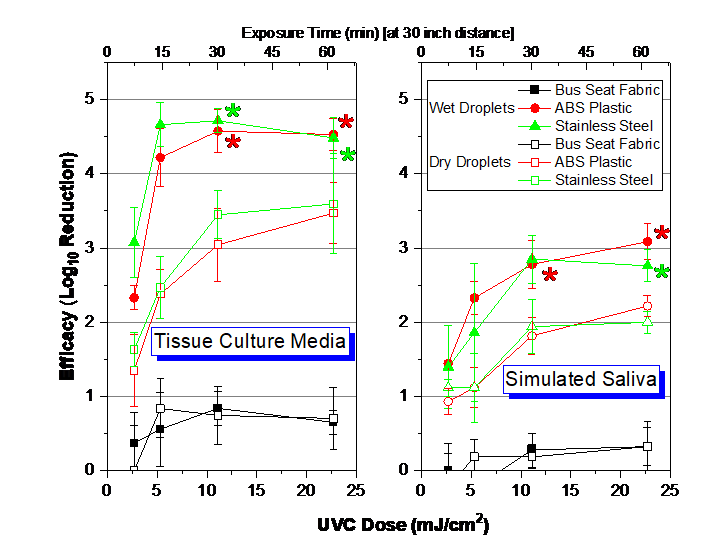
Figure 1: Dose-Response of SARS-CoV-2 with pulsed xenon light at 30” from surfaces. The error bars represent standard deviation from enumeration of both the positive control and test samples. Dose information is for multispectral UVC section of emitted UV spectrum. LOD set at 6.3 virions/sample. UVC dose measured with ILT 2500 and SED270C sensor. Asterisks refer to nondetects of SARS-CoV-2 after UVC exposure at the specific test condition.
LA Metro conducted a field study in a railcar equipped with multiple pulsed xenon lights and collected dose measurements at multiple distances from this array of pulsed xenon light sources. Only the lowest applied UVC dose of 2.7 mJ/cm2 from the SARS-CoV-2 lab study (Figure 1) is within the range of dose measurements measured during this field study (0.17-4.4 mJ/cm2).
Figure 2 shows the SARS-CoV-2 inactivation data as obtained with the LED (Transit Design Group), which emits light at 275 nm (Full width half maximum [FWHM] 11 nm) and at a UVA wavelength of 405 nm [FWHM 14 nm] with a second LED in the same unit.
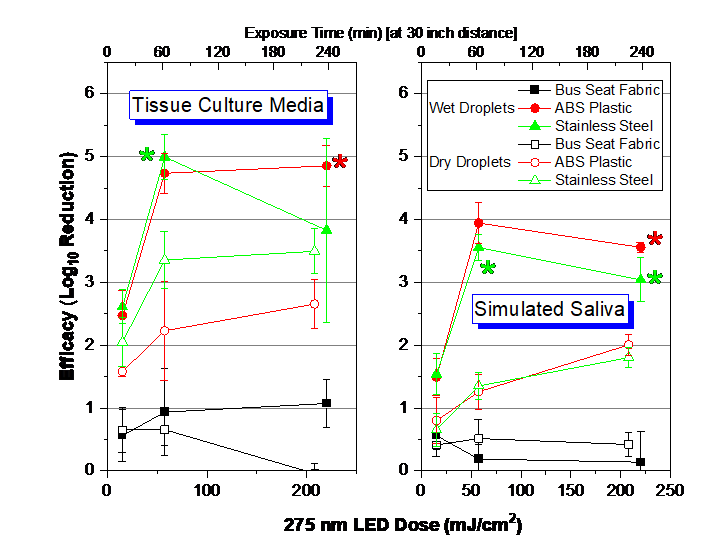
Figure 2: Dose-Response of SARS-CoV-2 with LED at 30” from surfaces except for the highest dose (collected at 15” distance). The error bars represent standard deviation from enumeration of both the positive control and test samples. Dose information is for 275 nm emitted light by LED. LOD set at 6.3 virions/sample. UVC dose measured with ILT 2500 and SED270C sensor. Asterisks refer to nondetects of SARS-CoV-2 after UVC exposure at the specific test condition.
Bacteriophages Exposure Studies
Sterile glass, ABS plastic, and stainless steel coupons (2 cm x 4 cm) were inoculated with either MS2 or Phi6 (each prepared in 5% Fetal Bovine Serum) at a target concentration of ~1 x 10⁶ plaque forming unit (PFU)/coupon. Each coupon was inoculated with a 10 μL droplet which stayed on the surface as a single droplet or was spread over at least 75% of the coupon surface using the pipette tip. After exposure to UV light, coupons were placed directly in individual tubes containing 10 mL of 10% Dey Engley (DE) broth, which were vortexed for 5 seconds. After completion of all test conditions, virions were extracted from the coupons by an additional vortexing for 2 minutes. Tenfold serial dilutions were prepared for each sample. Each dilution was plated in triplicate using a conventional soft agar overlay method[3] with E. coli and P. syringae as the bacterial hosts for MS2 and Phi6, respectively. After overnight incubation at 35 ± 2° C (E. coli/MS2) or room temperature, 21 ± 2° C (P. syringe/Phi6), plaques were manually enumerated. The efficacy / log reduction was calculated by the difference in mean log10 recoveries of positive control samples (samples not exposed to UV light) and of UV-exposed samples.
Figure 3 shows the observed log reduction of MS2 on 304 stainless steel and glass following UV light exposure from the LED light source. Results for the pulsed light source were reported in the November 10, 2020 data report[4]. Results were collected over multiple days under ambient laboratory conditions with variations in dose (as a function of changing distances and exposure times), material, and inoculation type (wet vs dry inoculum at start of UV exposure). Reported light dose measurements are for 275 nm emitted light (International Light Technologies [ILT] 2500 meter with ILT SED270 sensor) and excludes measurement of the 405 nm light intensity/dose. Recoveries from test coupons were always above the limit of quantification (10 PFU/coupon).
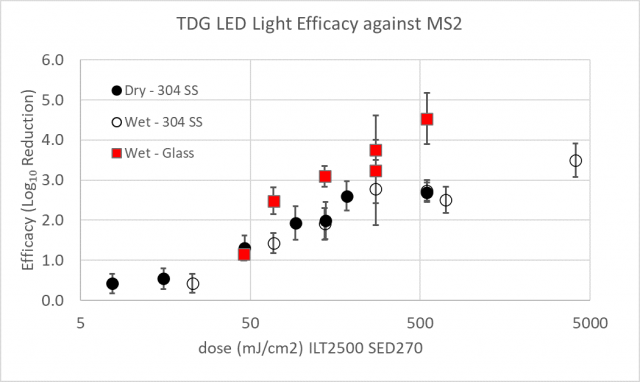
Figure 3: Dose response curve data and linear fits for MS2 and LED light for glass and 301 stainless steel (SS). The error bars represent standard deviation from enumeration of both the positive control and test samples. UVC dose measured with ILT 2500 and SED270 sensor.
Comparison of SARS-CoV-2, MS2 and Phi6 – Pulsed Xenon Light
In order to compare the SARS-CoV-2 data against the MS2 and Phi6 data, additional UVC disinfection tests were conducted such that a direct comparison could be made under identical test conditions. This included disinfection measurements for all materials except for bus seat fabric, inoculum distribution on the material (droplet versus spread), wet versus dry droplets at the start of the UVC exposure, and the use of tissue culture media versus simulated saliva as the inoculum composition.
Figure 4 shows a direct comparisons of log reductions in MS2 at one specific distance (15”) and exposure time (30 min) of the pulsed xenon light to the materials. Since these measurements were recorded over different days, actual recorded light doses varied between 40 and 49 mJ/cm2 (recorded with ILT 2500 and SED270C sensor).
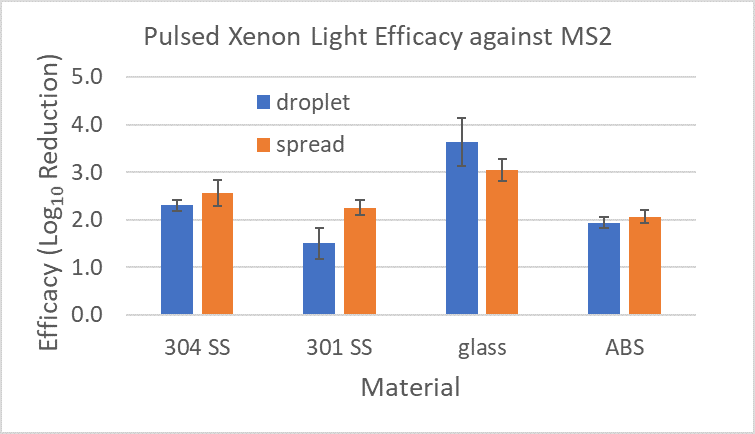
Figure 4: MS2 Log Reduction for various materials and inoculum distribution on the surfaces following exposure to pulsed xenon light. The error bars represent pooled standard deviation from enumeration of both the positive control and test samples.
Figure 5 shows direct comparisons of log reductions in MS2 at one specific distance (15”) and exposure time (30 min) of the pulsed xenon light to the materials. These measurements were recorded in a single experiment with a 41 mJ/cm2 dose (recorded with ILT 2500 and SED270C sensor).
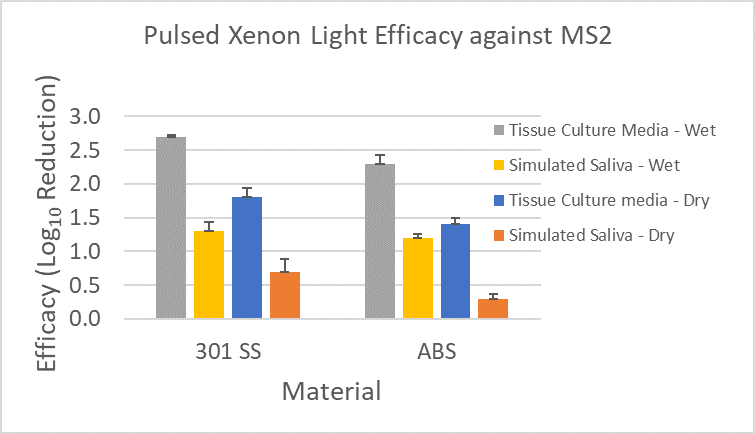
Figure 5: MS2 Log Reduction for various materials and inoculum types on the surfaces following exposure to pulsed xenon light. The error bars represent pooled standard deviation from enumeration of both the positive control and test samples
Similarly, Figure 6 shows a direct comparison of log reductions in Phi6 at one specific distance (15”) and exposure time (30 min) of the pulsed xenon light to the materials for a 42 mJ/cm2 dose (recorded with ILT 2500 and SED270C sensor).
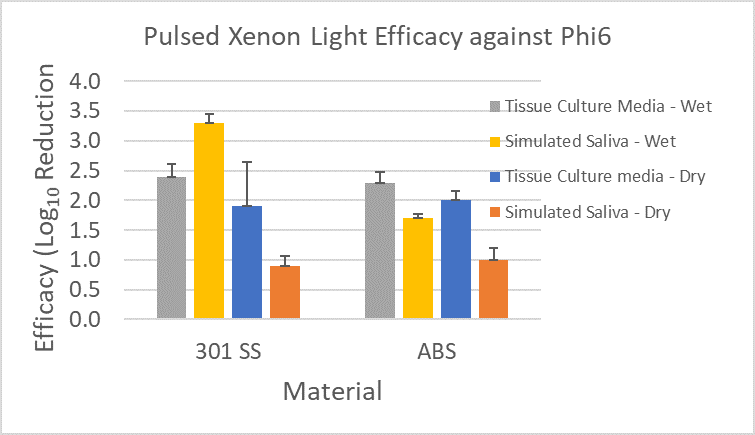
Figure 6: Phi6 Log Reduction for various materials and inoculum types on the surfaces following exposure to pulsed xenon light. The error bars represent pooled standard deviation from enumeration of both the positive control and test samples
A first comparison in measured log reduction by pulsed xenon UV light indicates that SARS-CoV-2 requires a lower dose to inactivate than MS2, as illustrated in Figure 7.
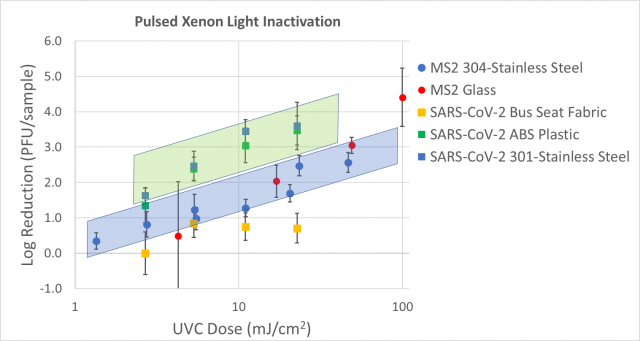
Figure 7: Dose response curve data and linear fits for SARS-CoV-2 and MS2, both in tissue culture media. The error bars represent standard deviation from enumeration of both the positive control and test samples. UVC dose measured with ILT 2500 and SED270C sensor.
While Figure 7 identifies some experimental differences such as the stainless steel appearance / smoothness, inoculum media and inoculum application (droplet versus spread), the combination of data shown in Figures 4 and 7 indicates that SARS-CoV-2 is easier to inactivate than MS2. The measured log reductions for MS2 and Phi6 on the same set of materials and inoculum matrices (Figures 5 and 6) indicate that MS2 and Phi6 behave similarly in their ability to be inactivated.
The UVC research results shown here and in the previous research update (November 10, 2020) identifies that SARS-CoV-2 can be inactivated by UVC light. There are, however, multiple aspects to consider when implementing the UVC disinfection approach. Most noteworthy is the need to deliver a sufficiently high UVC dose to surfaces to overcome some of the factors that negatively impact the observed log reduction.
[1] See https://www.astm.org/Standards/E3135.htm, Last accessed March 19, 2021
[2] Heimbuch et al. Am. J. Inf. Control 39, 2011; ASTM E2721-16
[3] Kropinski, A. M., Mazzocco, A., Waddell, T. E., Lingohr, E., & Johnson, R. P. (2009). Enumeration of bacteriophages by double agar overlay plaque assay. In Bacteriophages (pp. 69-76). Humana Press. Totowa, NJ. doi:10.1007/978-1-60327-164-6_7.