
Results for Aerosol Treatment Technology Evaluation with Grignard Pure
July 19, 2021 Report
Experimental Approach
A standard EPA, ASHRAE, or ASTM-approved method does not currently exist for evaluating efficacy of aerosol treatment products or devices against bioaerosols. Utilizing EPA’s specialized Aerosol Test Facility in Research Triangle Park, NC and experience in conducting research with aerosolized biological agents, a standardized approach that can be applied across multiple technology types was developed to achieve the objectives of this project. An objective of the test conditions was to maintain a high enough concentration of viable aerosolized test virus in the air for 90 minutes in control conditions (without technologies active) to be able demonstrate a 3-log (99.9%) reduction in airborne virus concentration during test conditions (with technologies active) relative to the time-matched control tests. For these tests, MS2, a nonpathogenic bacteriophage that infects Escherichia coli, was used as the test virus.
A large test section of the aerosol wind tunnel in EPA’s Aerosol Test Facility was sectioned off from the recirculating wind tunnel to serve as the test chamber utilized for this research. The 12 ft x 10 ft x 25 ft chamber provides a 3,000 ft3 conditioned space for dissemination and sampling of bioaerosols and for evaluating different aerosol treatment strategies (Figure 1). The chamber is temperature and relative humidity (RH) controlled, and its air is high-efficiency particulate air (HEPA)-filtered prior to each test. A mock heating, ventilation, and air conditioning (HVAC) system was designed and constructed in the test chamber to simulate air circulation and exchange rates typical of a wide range of general application settings. An Omni-Aire 1000V (Omnitec, Mukilteo, WA) negative air machine (NAM), with the HEPA filter removed, serves to represent a cold air return, recirculating air through the HVAC system and test chamber. A rectangular section downstream of the return serves as the installation section for aerosol treatment technologies. Air passing by the installed technology then flows through the 8-inch main duct before passing through six evenly spaced 6-inch branches that distribute air back to the chamber through 10-inch round diffusers with butterfly dampers at the distribution points. The system was constructed from galvanized steel materials, and the NAM airflow rate is set to 350 cubic feet per minute (CFM), resulting in approximately 7 air changes per hour (ACH) in the chamber. No outside air is introduced during testing. Two metal fans (LASKO 2265 QM, West Chester, PA) placed in opposite corners of the chamber facilitate mixing, operating at 1448 ft/min. In between tests, the chamber is opened, and recirculated HEPA-filtered air is run through the chamber until negligible particle counts are present in the air in preparation for the next test.
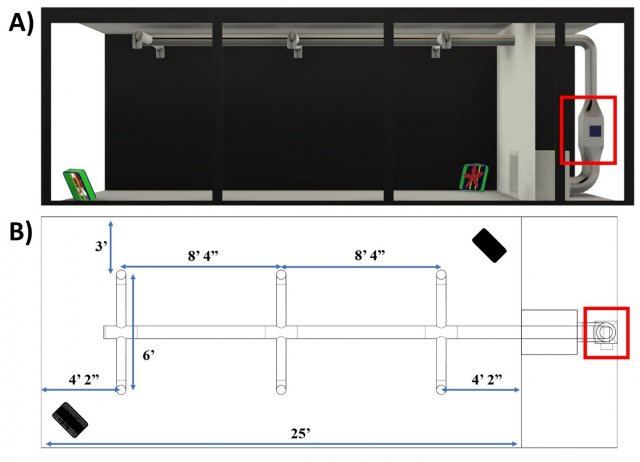
Figure 1. Test chamber schematics of A) side view and B) top-down view. The tested technology is installed in the rectangular section of the ductwork outlined in the red box.
The bacteriophage MS2 (ATCC 15597-B1), a non-enveloped virus that infects the host cell Escherichia coli (ATCC 15597), was used in this current study. Conducting research with aerosolized viruses at these large scales necessitates the use of safer, e.g., Biosafety Level (BSL)-1 potential surrogate viruses, versus using more pathogenic agents, such as SARS-CoV-2 (BSL-3). As a non-enveloped virus, MS2 is expected to be more resistant to chemical inactivation than enveloped viruses (e.g., SARS-CoV-2). MS2 stock is prepared using a top agar overlay technique, and samples are analyzed using a plaque assay with the E. coli host.
In this study, four 6-jet Collison Nebulizers (CH Technologies, Westwood, NJ) are used to aerosolize MS2 into the test chamber. In each nebulizer, a 10 mL mixture of 1:4 parts MS2 stock (MS2 in SM Buffer) to 0.22 μm filter-sterilized deionized water with 6 drops of Antifoam A (Sigma-Aldrich, St. Louis, MO) is nebulized over a period of 10 minutes prior to the first bioaerosol sampling period. Aerosolized MS2 is sampled using SKC BioSamplers (SKC Inc., Eighty-Four, PA) connected to air sampling pumps that draw air at a rate of 12.5 L/min. The sampling period for each aerosol sample is 10 minutes, resulting in a total volume of 125 L of air sampled during each sampling period. Bioaerosol samples are taken in duplicate from a 5 ft “breathing zone” height during each sampling period. The first aerosol sample in each test is taken immediately following the 10-minute aerosolization period (time = 0 sample). The count median diameter of aerosolized particles is 44 ± 2 nm at the beginning of each test (time = 0 min), and it increases over the duration of the test to 85 ± 3 nm at the end of 90 minutes, as measured by a Scanning Mobility Particle Sizer (Model 3080 Electrostatic Classifier/TSI 3022 Condensation Particle Counter, TSI Inc., Shoreview, MN).
Deposition of viable MS2 on surfaces and inactivation of MS2 on surfaces was also evaluated using uniform pieces of 2 cm x 4 cm stainless-steel material (coupons), which were prepared, cleaned, rinsed, and sterilized prior to testing. The deposition coupons were placed into the test chamber blank (i.e., clean, with no virus present prior to testing), and the inactivation coupons were inoculated with MS2 inoculum made in 5% Fetal Bovine Serum (FBS) with 1X phosphate-buffered saline (PBS) prior to being placed in the chamber. The two sets of coupons were co-located at five different locations on the chamber floor. The deposition coupons were placed inside the chamber to determine if the reduction of MS2 in the air was due to airborne inactivation or due to settling of viable virus particles.
Grignard Pure Results
Grignard Pure is an antimicrobial air treatment product that currently holds a Section 18 Emergency Exemption for use in certain indoor spaces in Georgia, Maryland, Nevada, Pennsylvania, Tennessee, and Texas. With the input of research stakeholders, this product was selected for evaluation to assess its efficacy as an aerosol treatment technology. Grignard Pure, which has a formula similar to a product commonly used in fog machines, contains the active ingredient, triethylene glycol (TEG). Under the current, EPA-approved emergency exemptions, the product can only be applied by trained professionals in indoor spaces, where high occupancy, poor ventilation, or other factors make it challenging to follow public health guidance and maintain appropriate social distancing. Use of the product does not eliminate the need to follow public health guidelines and adopt critical precautions, such as social distancing and mask wearing. Grignard Pure was disseminated into the test chamber through an AmHaze Stadium (CHAUVET Professional, Sunrise, FL) connected to the HVAC system (Figure 1). The effectiveness of Grignard Pure against the MS2 virus was evaluated in two test scenarios. In the first, the MS2 virus was first introduced into the chamber as an aerosol, the initial bioaerosol sample was taken to determine the virus concentration at time = 0 min, and then the Grignard Pure product was added to the chamber. This allowed for a direct assessment of the Grignard Pure product on a high concentration of the MS2 virus in the chamber air as a function of time since the product introduction. In the second scenario, the Grignard Pure product was first added to the chamber environment at the desired concentration before the MS2 virus was aerosolized in the chamber. This scenario more directly assessed the continued use of Grignard Pure in occupied spaces, where virus would likely be continually introduced into a space where the target concentration of Grignard Pure is maintained. The average concentration of TEG in the chamber during testing was measured in accordance with NIOSH Method 5523 and determined to be 1.2 – 1.5 mg/m3. All testing was conducted at 22 ± 2 °C and a RH of 30-35%[1]. This RH was selected because virus viability is reduced at intermediate RH[2], and an objective of the test design is to maintain a sufficiently high concentration of viable aerosolized MS2 after 90 minutes to allow for demonstration of a 3-log reduction in tests with technologies active relative to control conditions throughout the duration of each test.
Figure 2 shows the aerosol concentration of MS2 at each sampling time point during the tests. Four control tests (without the dissemination of Grignard Pure) were run on 5/19/21, 5/27/21, 6/3/21, and 6/10/21. Four tests were run introducing the product into the test chamber following the completion of the time = 0 min aerosol sample (represented by the warm colors; run on 5/20/21, 5/24/21, 6/1/21, and 6/8/21). Four tests were run with the product disseminated in the chamber prior to MS2 aerosolization (represented by the cool colors; run on 5/18/21, 5/25/21, 6/2/21, and 6/9/21). Each test was run for a duration of 90 minutes with duplicate aerosol samples taken at time = 0, 15, 30, 60, and 90 minutes.
![Figure 2. Concentration (in plaque forming units [PFU] per m3) of MS2 recovered from aerosol samples throughout the control and Grignard Pure (GP) tests.](/system/files/styles/medium/private/images/2021-09/figure-2-concentration.jpg?itok=vuM6Za1S)
Figure 3 shows the concentration of MS2 recovered at each sampling timepoint during testing, averaged over each set of Grignard Pure test conditions and controls. Figure 3A shows recoveries from when the product was introduced into the chamber following MS2 aerosolization and the time = 0 min sample is taken, and Figure 3B shows the average recoveries from when the product was introduced prior to aerosolization. The corresponding percent reduction in log10 recoveries at each sampling timepoint is also noted (except for the time = 0 min sample in Figure 3A, where the product had not yet been introduced).
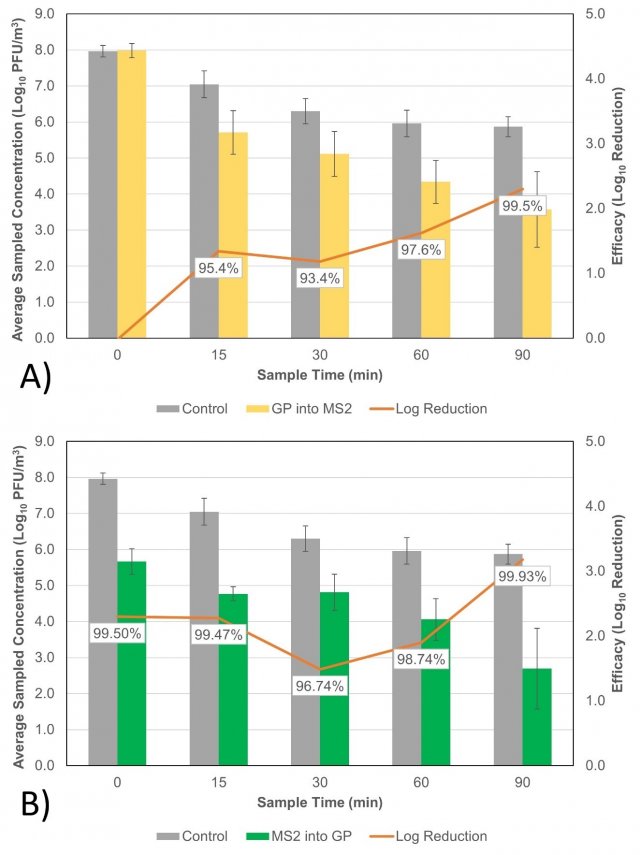
Figure 3. Concentration of MS2 at each sampling timepoint during the control tests and A) tests where Grignard Pure (GP) was introduced into the chamber following the time = 0 min sample and B) tests where GP was dispersed in the chamber prior to MS2 aerosolization. Error bars represent the standard deviation in averaged MS2 recoveries from each test condition. The average percent reduction in log10 recoveries between the test and control conditions are also noted for each sampling timepoint (except for time = 0 min in panel A, when the product had not yet been introduced).
Figure 4 shows the calculated log10 reduction in MS2 recoveries between the mean of the control tests and both Grignard Pure test conditions at each sampling timepoint.
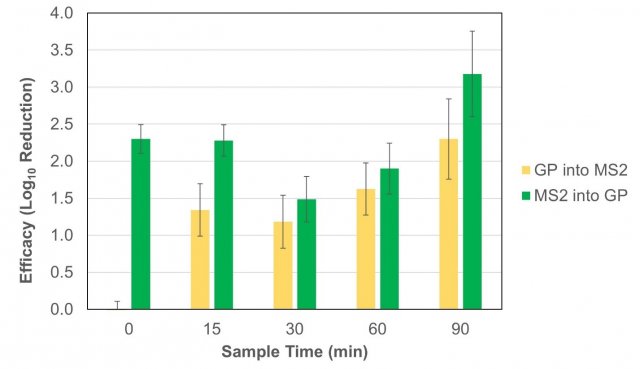
Figure 4. The calculated log10 reduction between the average recoveries of MS2 from the control tests and each of the two Grignard Pure (GP) test sequences (where product was introduced following the time = 0 min sample, “GP into MS2”, and where the product was introduced in the chamber prior to MS2 nebulization, “MS2 into GP”). Error bars represent pooled standard error from the test and control experiments.
Figure 5 shows the average recoveries of MS2 from both the inoculated coupons and the deposition coupons that were located in five different locations on the floor of the chamber throughout the duration of the tests. Coupons were included in the control tests from 5/19/21, 6/3/21, and 6/10/21; in the tests where Grignard Pure was introduced following the time = 0 minutes sample on 5/20/21, 6/1/21, and 6/8/21; and in the tests where the product was dispersed into the chamber prior to MS2 aerosolization on 5/18/21, 6/2/21, and 6/9/21. The average log10 reduction in MS2 recovered from inoculated coupons in the tests where Grignard Pure was introduced following the time = 0 sample relative to the control was 1.4 ± 0.3 log10 PFU/coupon, and it was 1.9 ± 0.3 log10 PFU/coupon for the tests where the product was dispersed in the chamber prior to MS2 aerosolization. The average log10 reduction in MS2 recovered from the deposition coupons in the tests where Grignard Pure was introduced following MS2 aerosolization and the time = 0 min sample tests relative to the controls was 1.6 ± 0.4 log10 PFU/coupon, and it was 1.9 ± 0.2 log10 PFU/coupon when the product was introduced prior to the MS2. The inoculated coupons were used to determine the surface inactivation of MS2 by Grignard Pure during testing, and the deposition coupons were used to determine the amount of viable MS2 that settled on surfaces during testing.
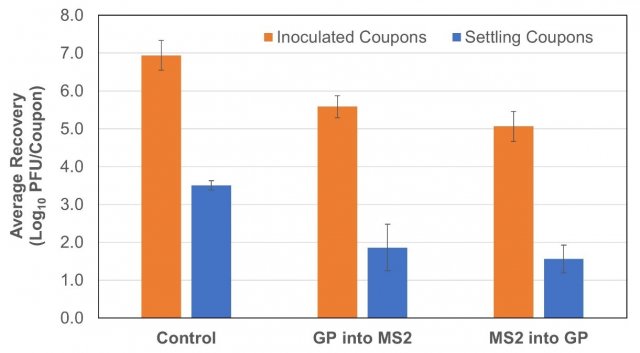
Figure 5. Average MS2 recoveries from stainless steel coupons placed into the test chamber inoculated with MS2 (inoculated coupons) and blank (settling coupons). Error bars represent the standard deviation of the averaged recoveries for each coupon type and test condition.
[1] EPA recommends that indoor relative humidity be maintained between 30% and 50% (https://www.epa.gov/iaq-schools/moisture-control-part-indoor-air-quality-design-tools-schools).
[2] Lin, Kaisen, and Linsey C. Marr. 2020. "Humidity-Dependent Decay of Viruses, but Not Bacteria, in Aerosols and Droplets Follows Disinfection Kinetics." Environmental Science & Technology 54 (2):1024-32. doi: 10.1021/acs.est.9b04959.