
Surface to Borehole Procedures
Overview of Borehole Seismic Methods
There are fundamental physical reasons why borehole seismic techniques can provide potentially better answers than conventional surface seismic techniques. There is a progression in both complexity and benefits from check shot and synthetic seismogram to vertical seismic profiles (VSP), three‑component VSP, offset VSP, and extrapolation and description of lithologic parameters into the geologic formations surrounding the borehole.
Presently VSP's are run in wells to aid in the correlation of surface seismic data. Borehole velocity surveys, commonly called check shot surveys, are often expanded into VSP's since additional acquisition costs are relatively small.
Synthetic Seismograms
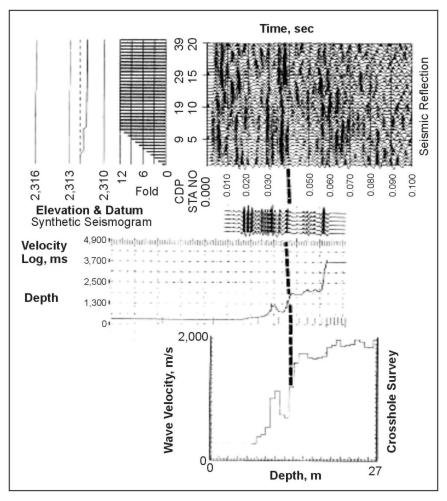
Synthetic seismograms have traditionally been used to correlate surface seismic sections. Like all theoretical models, synthetic seismograms suffer from the simplifying assumptions that go into the model. An approximate fit to surface seismic lines is often obtainable. However, synthetic seismograms offer an important link in trying to understand the seismic tie to the well log. An example of a synthetic seismogram is shown in figure 1.
Velocity Surveys
As discussed previously, velocity surveys in well bores are a well-established technology in the geophysical industry. An accurate measurement of the travel time and depth location, in combination with a knowledge of travel path, will provide the geophysicist with the necessary velocities to convert the seismic time sections to depth and also to migrate the data properly.
Sonic logs provide these data also; however, sonic logs are usually run only to the surface casing. Tying the information from the sonic log to the surface requires a velocity or check shot survey. Usually, enough levels are obtained in the well bore to provide sufficient detail to forego the data obtained from the sonic log.
Some problems that can affect sonic log data accuracy were discussed briefly in the section on overview of borehole seismic techniques. Seismic travel times are considered accurate within the limitations of sample rate and first break picking accuracy, and sonic times must be adjusted to fit seismic data.
Data Acquisition
Sources for data acquisition must be carefully chosen for the given desired depth penetration. These sources may include explosives, airguns or water guns in containers, or vibrators. Source and acquisition parameters often tend to match those used during acquisition of surface seismic data. Receivers are downhole geophones. A more detailed discussion of source and receiver characteristics will follow in the section on vertical seismic profiling.
In locating the source, an attempt is made to obtain a travel path that minimizes refractive bending through the formations. For the case of horizontal layering and a vertical well, that would imply placing the source close to the well bore. For a deviated well, the source is frequently moved above the receiver in the well. This, of course, requires information from a well deviation survey prior to the check shot survey. Dipping layers can also introduce sizeable changes in travel time because of refraction along bed boundaries.
When working with surface sources such as vibrators, it is advisable to obtain some shallow levels in order to get some information on velocities in the weathered zone. The limitation in this case is the source location, since the drilling platform itself may take up a sizeable space. In addition, refracted arrivals from the top of the subweathering zone or casing may interfere with direct arrival through weathering.
When working with explosives, an uphole high‑velocity geophone is needed to obtain the uphole times. A proper shot depth geophone is needed to obtain the uphole times. Proper shot depth with the uphole time can provide the information on weathering velocities. Shot holes are generally located some distance from the well bore to prevent well bore damage. Therefore, in this case, shallow levels in the borehole may not add much to the survey.
Concerning the placement of geophones in the borehole, the geologists often pick recording depths corresponding to formation tops obtained from logs. If acoustic boundaries of sufficient contrast are in that vicinity, interference between direct and reflected arrivals may lead to errors in first arrival times. Better receiver locations can sometimes be picked below the horizon of interest from existing sonic logs. Another effect may include the gradual polarity reversal of the first break
If receiver spacing is too close, there may be errors in computed interval velocities. In this case, the picking of the first break is rarely more accurate than 1 ms. With a receiver spacing of, for example, 30 m and a velocity of 3,000 m/s, a 1-ms error would amount to a 10% error in the computation of velocities.
Data Processing
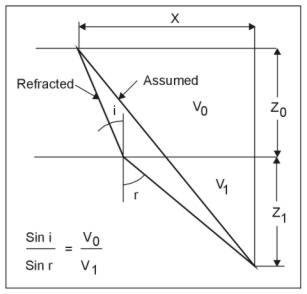
When converting travel times to vertical travel times, a straight-line path is normally assumed, as shown in figure 1. Refinement of the results can be obtained by modeling and using the initial straight ray path as a first guess. For a vertical well, the horizontal distance from the source to the well and the vertical distance from the source to the geophone in the well are used. For the deviated well, the horizontal distance from the energy source to the geophone is used in addition to the vertical distance. The azimuth of the energy source is required when corrections for deviations are required. For offset or walk-away shooting, where the source is moved, the coordinates must be known for every shot.
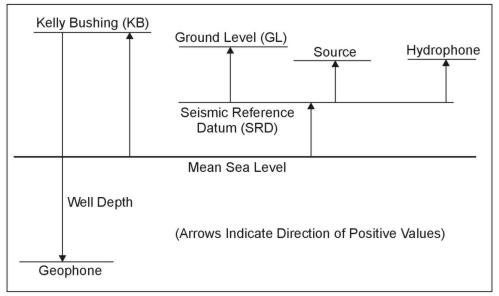
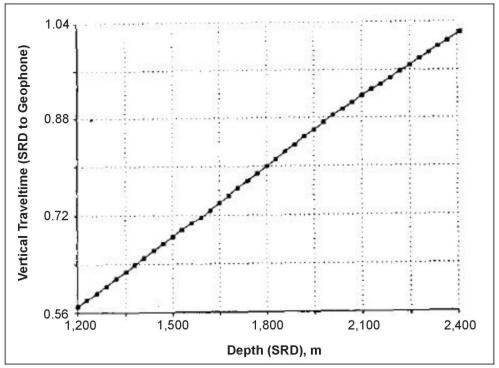
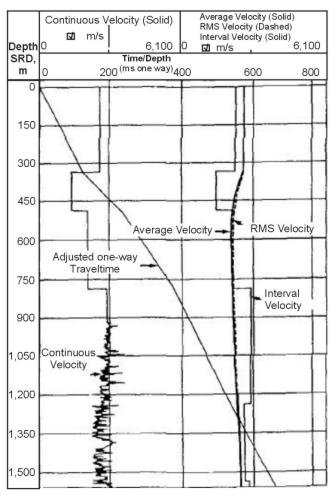
All computations are corrected to the seismic reference datum (SRD). These corrections are summarized in figure 2. Finally, the corrected computations are displayed in the familiar time‑depth plot shown in figure 3. This graph also provides an opportunity for quality control. Points deviating greatly from the trend may require a more detailed evaluation.
Results of the survey or check shot survey are used to tie time to depth and calculate average, interval, and RMS velocities (see figure 4). These velocities are used to study normal moveout (NMO) in data migration and are often used to correct sonic logs prior to the computation of a synthetic seismogram.
Vertical Incidence VSP
Vertical seismic profiling has been one of the more rapidly developing technologies in geophysics in recent years. It is perhaps surprising that the information following the first breaks on the seismic trace routinely recorded in velocity surveys was simply disregarded. Acquisition in the field for VSP's consisted then merely of the addition of a sufficient number of geophone depth levels in a routine velocity survey. The additional rig time was perhaps the major deterrent to the widespread use of VSP's in the industry.
The geophysicist had also settled for the use of check shot surveys and synthetic seismograms to provide him with a more or less accurate nexus between surface seismic profiling and the well bore. This meant accepting all the assumptions of plane acoustic waves striking a horizontally layered medium at incidence to obtain a model of a seismic trace arriving at the surface. Another shortcoming was the lack of knowledge of the makeup of the seismic wavelet.
The VSP permits the actual measurement of seismic energy as a function of depth. The surface geophone measures only the upgoing wave. The downhole geophone measures the downgoing wave field in addition to the upgoing wave field. Effects of reflection, transmission, multiples, and attenuation can be traced as a function of depth. The increase in resolution resulting from retention of higher frequencies (due to the decrease in travel path to the downhole geophone compared to a surface geophone) permits more confident measurement of lithological effects than ever before from surface seismic profiling.
The advent of shear-wave seismic technology has brought with it the difficulty of resolving both P- and S-waves to the same lithologic boundary. Again, the VSP can provide an accurate tie between these two events. Finally, the VSP is one of the more effective means to provide quality control for both surface seismic profiling and the generation of a reasonable synthetic seismogram. As the geophysicist gains experience with VSP acquisition, processing, and interpretation, this relatively new technology will become an integral part of exploration technology.
- Principles
- Synethic VSP's
- Survey Sources and Equipment
- State-of-the-Art Technology
- Borehole Seismic Operations
- Planning
- Quality Control
- Conclusions and Examples
Principles
Simultaneous recording of both upgoing and downgoing wave fields by the downhole geophone requires some discussion of the principles involved. In figure 1(b), examples of some possible upgoing and downgoing events are displayed. For convenience and clarity, upgoing events are to the left of the well, downgoing are to the right. Furthermore, only two geophone locations are shown, again separated for convenience in illustrating the concept. In reality, more events than those shown are possible. Figure 1(a) is the simple impedance model for this hypothetical well. Figure 1(c) shows the VSP generated from this model as a function of the depth of the well versus one-way time.
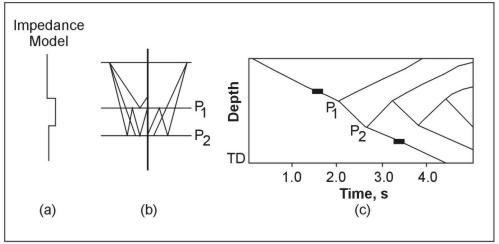
In zero-offset VSP's, the primary events are symmetric to the first arrivals, and together with the first arrivals, have typically a "V" shape. Primary reflection P1 illustrates the time‑depth tie necessary for correlation.
The diagram shows the important fact that upward-traveling multiple events cease as soon as the geophone is located below the last reflector involved in its generation. The primary reflection and all the multiples in its tail have their last bounce on that reflector; thus, when the geophone is below that reflector, primary and upgoing multiple reflections in the tail can no longer be recorded. This multiple, or reverberant, is henceforth only present in the downgoing wave below this point. Upgoing events that terminate within the data permit the recognition of the origin of a multiple.
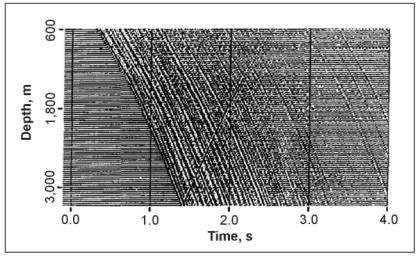
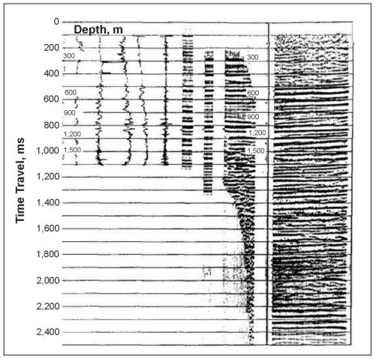
Figure 2 shows a real VSP with data corrected for amplitude losses. The traces are arranged with depth increasing from top to bottom and time increasing to the right; thus, longer travel times to the first arrival are seen with increasing depth. One should note the sparsity of strong upgoing events and the usual predominance of downgoing multiple events from near-surface highly reverberant systems. When lowering the geophone, a downgoing multiple event will be delayed by the same additional amount as the primary event.
As a result, in the case of horizontal layering, the whole family of multiples follows but remains parallel to the first arrival alignment. This fact will subsequently be exploited in the processing of the vertical incidence VSP. The first arrivals then draw the time‑depth curve. As the geophone moves farther from the source, it moves closer to the reflector. The additional delay from source to receiver, therefore, is equivalent to an identical loss in travel time from reflector to receiver in horizontal layering. As a result, reflected arrivals slope in the opposite direction from first arrivals.
Synthetic VSP's
The synthetic VSP is rapidly becoming a valuable aid in studying the behavior of upgoing and downgoing wave fields with acoustic impedances obtained from borehole logging. Whereas the synthetic seismogram models a layered earth as seen from the surface, the synthetic VSP is a study of seismic events as a function of depth. It also allows the interpreter of VSP's to gain a better understanding of the complexities of interacting wave fields and gives more confidence in interpretations.
In calculating synthetic VSP's, one should incorporate the various multiple events. Upward‑ traveling multiples are reflected an odd number of times, downward‑traveling multiples are reflected an even number of times (figure 1). For upward-traveling multiples, a so‑called first- order multiple would have been reflected three times, a second order multiple five times, etc. By analogy, a first-order multiple for downgoing waves has been reflected twice, etc. (see figure 1).
For a synthetic VSP, the earth model is divided into equal travel time layers. The total seismic response for the layered system can be computed from the individual contributions of upgoing and downgoing waves at the individual interfaces for all the layers in the model. Multiples up to a given order can be included with overall attenuation as a function of reflection losses. The proper choice of input wavelet again becomes important if one attempts to match a synthetic with a real VSP.
It is noted that the real VSP may be contaminated by random and coherent noise, difficult to reproduce with a synthetic. In order to illustrate the principles and the effects illustrated above, a simple model and the synthetic VSP calculated from it are shown in figure 3 (Wyatt, 1981). The velocity contrasts in the model are rather large to accentuate the effects discussed above. Velocities are seen to range from 1,500 to 6,100 m/s. Density was held constant.

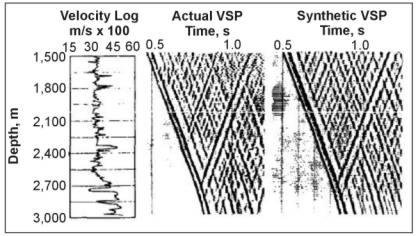
Real VSP's rarely show multiple events that clearly. The first arrival slopes in this model show the velocity changes clearly. Amplitudes of primary events give a good indication of the impedance contrast at the boundaries. Amplitudes also show how a shallow reverberant system gives rise to many strong multiples. The origin of multiples is also clearly visible on this synthetic VSP. An excellent example of a comparison between a synthetic and a real VSP is shown in figure 4. Coherent noise interference for the example is seen between 1676 and 1828 m on the real VSP. Differences in primary and multiple amplitudes are also very much apparent. Synthetics then become a valuable aid (but not a replacement) for measuring true waveforms in the earth.
Survey Sources and Equipment
Selecting a source for a VSP survey is largely a function of what was used in obtaining surface seismic data. For improved matching of VSP and surface seismic data, the same sources are desirable for both surveys. To date the majority of seismic data are collected with vibrators, airguns, and explosives. However, a number of other devices have appeared on the market and some familiarity with signal strengths and source characteristics is desirable. A great deal of care must go into the choice of sensors and recording equipment.
In VSP work, demands on recording equipment and the number of sensors employed are much smaller than in surface seismic operations. Recording equipment may have as few as two channels for single-axis tools. Downhole sensors may have only a single geophone per axis with three‑axis tools. Downhole geophone tools require a clamping mechanism. Data for VSP's and check shots have been collected both with geophones and hydrophones in the downhole environment for specific applications.
State-of-the-Art Technology
State‑of‑the‑art geophones may be used in downhole seismic data acquisition. A variety of choices are available in the marketplace. As a starting point in downhole tool evaluation, the geophysicist should know the amplitude and phase response of each type of geophone used in the tool. This is of increased importance when considering the differing response characteristics of vertical and horizontal geophones used in the three‑axis tools.
Additional complications are introduced by geophone‑to‑ground or formation coupling. Seismic phase and amplitude are highly distorted upon approaching resonant frequencies. The useable seismic frequency band must then remain well below the frequency peaks introduced by coupling to the formation. These formation-coupling effects do exist in the borehole. Here the geophone becomes part of the larger downhole tool, which, in combination with the formation, can give rise to formation coupling resonances. In practice, this is mostly experienced with horizontally oriented geophones. With presently available commercial tool designs, coupling resonances have been observed to fall into a frequency range as low as 18 to 30 Hz.
Borehole Seismic Operations
For borehole seismic operations, conventional surface seismic systems are more than adequate for most applications. The requirement of only a few channels simplifies the field acquisition. Adjustable fixed downhole gain is most certainly desirable to prevent overdriving of the surface amplifiers by direct arrival.
With continued interest in shear-wave data from three‑axis VSP's and large S-wave sources, shear-wave attenuation rates amount to twice the decibel loss of that experienced by compressional waves. Adding attenuation losses from spherical divergence, scattering, and transmission losses would quickly tax the dynamic range of most recording equipment except for low frequencies.
Planning
It has become apparent from the preceding sections that more than casual job planning is required to obtain good field data. A variety of additional field parameters are to be determined prior to venturing out into the field. Rig time and source expense often lead to a series of compromises concerning sources, and number of levels obtained in the well. Source offset may be a function of desirable noise suppression of tube waves. Shallow levels are often noisy.
Quality Control
Quality control must extend to the borehole environment. Poor tool coupling may lead to tool creep or slippage. Improved clamping pressure, or perhaps installation of clamping arms or a more suitable length for a given borehole, will usually solve creep and slippage problems with their attendant noise bursts. Slacking off the cable eliminates cable waves in addition to reducing surface noises traveling down the cable. Tool resonance associated with poor coupling at a given location is solved by moving the tool to a different location. Both caliper and sonic logs may become helpful in relocating the tool.
The effects of casing may lead to additional phenomena in VSP acquisition. Refracted casing arrivals may precede direct arrivals. Unbonded casing may lead to casing ring. Cased hole VSP's can be obtained after the rig has moved off the site. This leads to a sizable savings in rig time during acquisition.
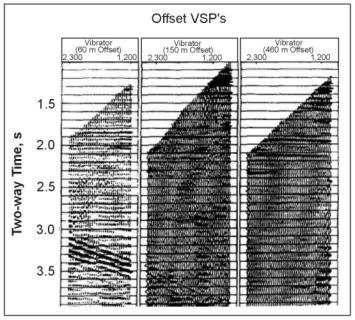
The effect of tube waves in VSP recording is coherent noise. Tube waves can be generated by body waves impinging on the borehole or by surface waves crossing the borehole. Tube wave velocities typically arrive at velocities of about 1,450 m/s. There are a number of field approaches to reduce tube waves such as improved clamping. Another approach is source offset from the borehole shown in figure 5. Different sources give rise to sizeable differences in tube wave energy.
With increasing experience in both data acquisition and processing, VSP can supply the additional refinements in seismic exploration that heretofore were elusive with surface methods. Data from the VSP can now help to solve a number of exploration problems and give the additional confidence needed to solve interpretational ambiguities.
In the past, direct correlation of synthetic seismograms with surface seismic profiling, however successful in some areas, led to a great number of unresolvable errors between well logs and surface seismic profiling. The synthetic seismogram, after all, is a theoretically calculated response based on some rather simple assumptions and, as applied to logging data, is subject to all the various restrictions discussed in earlier sections. With the VSP, one finally has a measured response of the Earth to the actual source wave field as it progresses with depth.
A connection can now be established directly between seismic analysis and well bore information. The synthetic then becomes a means to model and study seismic signal interaction with the details of formations rather than serving explicitly as a link to the well. A synthetic log is then relegated to serve to some degree as quality control in the design of VSP data acquisition in conjunction with ray trace modeling and synthetic VSP computations. A well tie that serves both the geologist and the geophysicist will typically include the display of time‑scaled logs, synthetic log, corridor or sum stack, the VSP itself, and the surface seismic section.
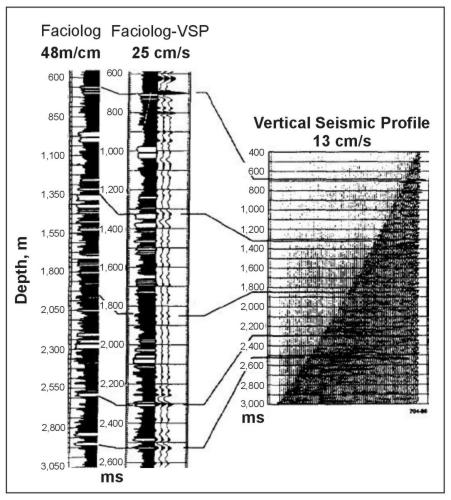
In addition, a VSP converted to an equivalent section by summing corridors of traces along equal offset distances from the well bore may be included. A variety of displays can now aid the interpreter. Figure 355 shows the correlation from time-scaled logs to VSP to surface seismic. Shown from left to right are caliper, gamma ray, bulk density, sonic, reflectivity, synthetic log, corridor stack, VSP‑CDP, and surface seismic data.
Conclusions and Examples
Many benefits can be obtained as noted in previous discussions on vertical VSP applications. Careful calibration of logs with VSP's and calibration of VSP's with surface seismic profiling can lead to better refinement in the interpretive process. Correlation of log-derived lithologic facies can be directly correlated with the results of seismic studies.
To establish better communication between geologist, log analyst, and geophysicist, displays such as that shown in figure 7 were developed. Additional calibration with logs and seismic profiling can be achieved by comparing data from seismic events to those obtained from logs. Amplitudes of reflection coefficients and seismic events may be correlated with more confidence to porosity, pore fluids, saturation, and lithology after proper calibration with logs.
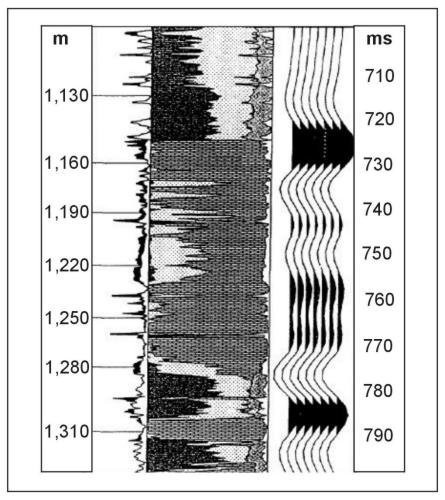
An example of how a VSP is correlated with existing log information is shown in figure 8. In this example from the petroleum industry, the repeated sum stack trace is correlated to a time-scaled, log-derived section of the borehole showing lithology, porosity, and hydrocarbon saturation. The lithologic column indicates the volumetric percentage of the major constituent lithologies of the formation. Note that the peak of the seismic reflector yields an excellent fit with the top of the carbonate section (top of the reservoir). Hydrocarbon saturation, shown on the far left, is seen to increase at the top of the reservoir.
The pages found under Surface Methods and Borehole Methods are substantially based on a report produced by the United States Department of Transportation:
Wightman, W. E., Jalinoos, F., Sirles, P., and Hanna, K. (2003). "Application of Geophysical Methods to Highway Related Problems." Federal Highway Administration, Central Federal Lands Highway Division, Lakewood, CO, Publication No. FHWA-IF-04-021, September 2003.