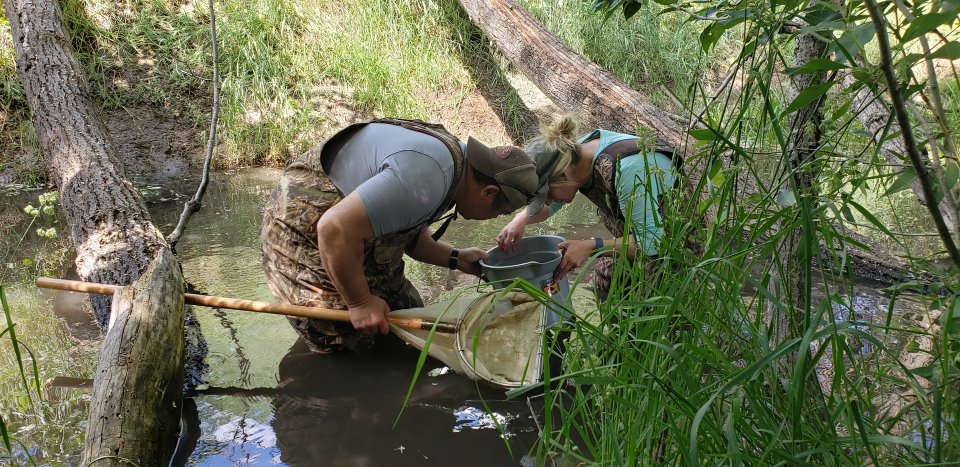
National River and Streams Assessment 2018-19 Key Findings
National Rivers and Streams Assessment: The Third Collaborative Survey of Rivers and Streams in the United States
Key Findings
Clean and healthy rivers and streams enhance the quality of our lives. They supply our drinking water, irrigate our crops, provide highways for shipping, and offer us recreation. They support aquatic life and provide shelter, food, and habitat for birds and wildlife. Rivers and streams shape America’s landscape. They are the land’s vast, interconnected circulatory system, carrying water from the mountains to the sea.
The National Rivers and Streams Assessment: The Third Collaborative Survey presents the results of the 2018-19 survey of perennial rivers and streams in the conterminous United States. The NRSA is part of the National Aquatic Resource Surveys, a series of statistically-based assessments designed to provide the public and decision-makers with nationally consistent and representative information on the condition of the nation’s waters.
To read the complete report, visit the NRSA 2018-19 web report.

Less than one-third of our river and stream miles (28%) had healthy biological communities, based on an analysis of benthic macroinvertebrate communities.
- Biological condition was based on the abundance and diversity of benthic macroinvertebrates (bottom-dwelling invertebrates such as dragonfly and stonefly larvae, snails, worms, and beetles).
- Close to half of river and stream miles (47%) were in poor condition.
Just over one-third (35%) of river and stream miles had healthy fish communities.
- Fish community health was based on fish abundance and diversity.
- Sixteen percent of river and stream miles were not assessed for fish. The remainder (49%) were in fair and poor condition.
Nutrients (phosphorus and nitrogen) were the most widespread stressors.
- Forty-two percent of the nation’s river and stream miles were in poor condition, with elevated levels of phosphorus, and 44% were in poor condition for nitrogen.
- Poor biological condition was more likely when rivers and streams were in poor condition for nutrients.
Reducing nutrient pollution could improve biological condition.
- NRSA analyses indicated that approximately 20% of the river and stream miles in poor biological condition could be improved if nutrient condition changed from poor to fair or good. The level of improvement was estimated to be similar regardless of nutrient and biological indicator analyzed.
Healthy habitat occurred in over half of our river and stream miles.
- Physical habitat indicator scores revealed that 68% of river and stream miles were rated good for in-stream fish habitat, 57% scored good for streambed sediment levels, and 56% of river and stream miles had good ratings for riparian vegetation (vegetation on or adjacent to the river or stream banks).
- However, 64% of river and stream miles had moderate or high levels of riparian disturbance.
Bacteria exceeded EPA’s recreational benchmark in 20% of river and stream miles.
- Enterococci, bacteria that indicate fecal contamination, were above EPA’s benchmark in 20% of river and stream miles.
- Swimming and recreating in water contaminated with pathogens could make people ill.
Algal toxins were present, but at very low levels, with minimal recreational human health concerns.
- Microcystins and cylindrospermopsin were detected in 9% and 10% of river and stream miles, respectively, but did not exceed EPA recommended criteria in any samples.
Contaminants were present in all fish tissue, but risk varied by contaminant and fish consumption levels.
- In samples composed of fillet tissue from multiple fish, concentrations exceeded screening levels as follows (as a percentage of the 41,099 river miles comprising the sampled population):
- Mercury: 26%
- Total PCBs: 45% for general fish consumers, 74% for high-frequency fish consumers.
- Additionally, PFOS was detected in 91% of the 290 fish composite samples analyzed for NRSA 2018-19. EPA is not currently comparing PFOS concentrations in fish to screening levels because the toxicity assessment used to calculate screening levels is draft. When the assessment is final, EPA intends to update the PFOS information provided in this report to include screening level exceedances.

