
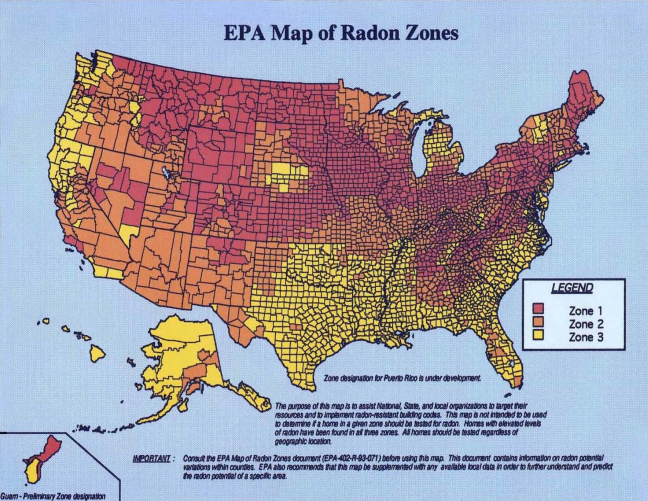
EPA Map of Radon Zones
The U.S. Environmental Protection Agency (EPA) created this map to identify areas with the potential for elevated indoor radon levels. The EPA Map of Radon Zones helps national, state, and local organizations implement radon-resistant building codes. The map should not be used to determine if a home in a given zone should be tested for radon. Homes with elevated levels of radon have been found in all three zones. All homes should be tested for radon.
The purpose of this map is to assist national, state and local organizations to target their resources and to implement radon-resistant building codes.
Map of Radon Zones
| Color | Zone | Potential |
|---|---|---|
| Zone 1 (red zones) | Highest potential; average indoor radon levels may be greater than 4 pCi/L (picocuries per liter)(150 becquerels per cubic meter (Bq/m3)) | |
| Zone 2 (orange zones) | Moderate potential; average indoor radon levels may be between 2 and 4 pCi/L (75 -150 Bq/m3) | |
| Zone 3 (yellow zones) | Low potential; average indoor radon levels may be less than 2 pCi/L (75 Bq/m3) |
The Map of Radon Zones was developed in 1993 to identify areas of the U.S. with the potential for elevated indoor radon levels. The map is intended to help governments and other organizations target risk reduction activities and resources.
No matter where you live, test your home for radon—it’s easy and inexpensive. Fix your home if your radon level is 4 picocuries per liter (pCi/L) (150 becquerels per cubic meter (Bq/m3)) or higher. Consider fixing if your level is between 2 and 4 pCi/L (75 - 150 Bq/m3).
The Map of Radon Zones was developed using data on indoor radon measurements, geology, aerial radioactivity, soil parameters, and foundation types. EPA recommends that this map be supplemented with any available local data in order to further understand and predict the radon potential for a specific area.
Text Version of the Data
Here is a table with the raw unfiltered data. Search through the table for your county or state.
You can download this information as XLS or JSON:
| County,State | COUNTY LABEL | STATE | Region | Zone |
|---|