
Climate Change Connections: Nebraska (College World Series)
Climate change is impacting all regions and sectors of the United States. The State and Regional Climate Change Connections resource highlights climate change connections to culturally, ecologically, or economically important features of each state and territory. The content on this page provides an illustrative example. As climate change will affect each state and territory in diverse ways, this resource only describes a small portion of these risks. For more comprehensive information about regional climate impacts, please visit the Fifth National Climate Assessment and Climate Change Impacts by Sector.
On this page:

Introduction: The College World Series Contributes to the Local Culture and Economy
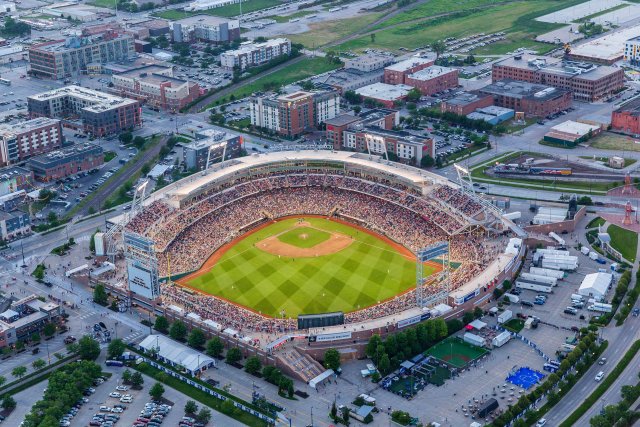
The Men’s College World Series has been an annual tradition in Omaha, Nebraska, since 1950. Held annually in June, the college baseball championship attracts hundreds of thousands of baseball fans who come from near and far to watch the season’s top teams play. The weeks-long tournament and associated activities contribute to the local economy and sense of community pride in Omaha. Annually, the College World Series supports hundreds of jobs and contributes tens of millions of dollars to the local economy—particularly the bar and restaurant, hotel, entertainment, and recreation industries.1
Climate Impacts: Warming Temperatures Can Be Dangerous for Athletes and Fans
Climate change is expected to affect outdoor sports in many ways.2 Across the United States, heat waves have become longer, more frequent, and more intense.3 Extreme weather and heat can decrease performance and increase health risks for athletes of all ages, especially young athletes.2 During the 2022 College World Series, high temperatures were noted in reports of paramedics treating dozens of people each day and transporting multiple people to the hospital for heat-related illness.4,5 High temperatures can affect athlete safety and performance.6 Without adaptation, the risk of heat-related illnesses for College World Series attendees and players could grow in the future as temperatures are projected to increase.
The heat island effect is expected to make warming temperatures even more pronounced in cities like Omaha. Urban environments tend to be hotter than surrounding natural areas because human-made materials, such as traditional pavement and roofs, absorb and re-emit more of the sun’s heat.7 Increasing warming trends due to climate change are intensifying already higher temperatures in heat island areas. This continued warming is expected to worsen the heat island effect in the future.8–10 Large areas of asphalt surround the College World Series venue in downtown Omaha, contributing to the heat island effect. One climate model projects that, by 2050, Omaha could experience more than twice the days per year with a maximum temperature above 90°F, compared with the 1961 to 1990 average of 27 days.11 Because of its location within a heat island, the College World Series venue is particularly vulnerable to the impacts of warming temperatures.
The heat island effect makes heat waves feel hotter and increases the risk of heat-related illnesses. When people are exposed to extreme heat, they can suffer from potentially deadly conditions, such as heat exhaustion and heat stroke. Hot temperatures can also contribute to deaths from heart attacks, strokes, and other forms of cardiovascular disease.12 According to the National Weather Service, heat is the leading weather-related killer in the United States, even though most heat-related deaths are preventable through outreach and intervention.12 Due to a variety of factors, older adults are particularly vulnerable to heat-related stress and should take extra precautions when exposed to high temperatures.13
Climate Impacts: Heat and Precipitation Can Change the Game
Climate change can affect the intensity and frequency of precipitation. As average temperatures at the Earth’s surface rise, more evaporation occurs, resulting in increased precipitation in some places. Climate change can contribute to more heavy precipitation events, in which the amount of precipitation experienced in a location substantially exceeds the norm. In recent years, a greater percentage of precipitation has come in the form of intense, single-day events.14 While annual rainfall has been variable, Nebraska has experienced an increase in extreme precipitation events, and this trend is expected to continue.15 Changing rainfall patterns could affect the College World Series. Playing on a wet baseball field slows the game down and increases the risk of injuries.16 Baseball cannot be played in heavy rain.16 As heavy precipitation becomes more prevalent, rain could delay or postpone games more frequently.
While heat affects player and spectator safety, higher temperatures can also make it easier to hit home runs. Warm air is less dense than cool air,17 which allows balls to travel farther and may make it easier for batters to hit the ball out of the field and score home runs. Major League Baseball has experienced an increase in the number of home runs per game since 1980, which coincides with an increase in the average daily high temperature on game days.18 An analysis of these historical trends found a significant relationship between increased home runs and warmer ballpark temperatures due to the impact of warming temperatures on air density.18 The probability of a home run increases with temperature even when the ball’s launch angle and speed are the same.18 As temperatures rise, home runs could become more common during the College World Series, altering the dynamics of the game.
Taking Action: Protecting People and the Game
Addressing climate change requires reducing greenhouse gas emissions while preparing for and protecting against current and future climate impacts. Communities, public officials, and individuals in every part of the United States can continue to explore and implement climate adaptation and mitigation measures. Organizers and officials can continue to take steps to keep outdoor recreation safe in a changing climate, including:
- Heat safety precautions. Frequent and mandatory water breaks; limited time in full equipment and direct sunlight; and lightweight, light-colored clothing can all help reduce overheating and exertional heat illness for players during practices and games.6 Communicating with players, coaches, and fans about the signs of heat illness is important to protect people.6 To avoid the worst heat, some sports shift games to later in the evening, when temperatures are cooler.19 Portable cooling centers, misting tents, and hydration stations can help fans stay safe in the heat.19
- Green infrastructure. At the city level, green infrastructure can help reduce the heat island effect in downtown Omaha. Across the country, cities are exploring green infrastructure to help reduce urban heat island effects by shading building surfaces, deflecting radiation from the sun, and releasing moisture into the atmosphere.20 Planting more trees and vegetation in the area helps cool local air temperatures through shading and evapotranspiration.21 Cool pavement and cool roof technologies, which are designed to remain cooler than conventional materials, can also help reduce the heat island effect.22,23
To learn more about climate change impacts in Nebraska and the Northern Great Plains region, see Chapter 25 of the Fifth National Climate Assessment.
Related Resources
- EPA Climate Change Indicators: Seasonal Temperature
- EPA Climate Change Indicators: Heat-Related Illnesses
- Heat Island Effect (EPA)
- Climate Change Implications for Nebraska (University of Nebraska–Lincoln)
- Nebraska State Climate Office (University of Nebraska–Lincoln)
- Heat and Athletes (Centers for Disease Control and Prevention)
- Nebraska State Climate Summary 2022 (NOAA)
References
1 College World Series of Omaha, Inc. (n.d.). Economic impact. CWS Omaha. Retrieved May 12, 2023, from https://cwsomaha.com/sports/2023/3/13/economic-impact.aspx
2 McPherson, R. A., Fay, P. A., Alvarez, S. G., Bertrand, D., Broadbent, T. L., Bruno, T., Fares, A., McCullough, B., Moore, G. W., Moorhead, B., Patiño, L., Petersen, A., Smith, N. G., Steiner, J. L., Taylor, A., & Warziniack, T. (2023). Ch. 26. Southern Great Plains. In A. R. Crimmins, C. W. Avery, D. R. Easterling, K. E. Kunkel, B. C. Stewart, & T. K. Maycock (Eds.), Fifth National Climate Assessment. U.S. Global Change Research Program. https://doi.org/10.7930/NCA5.2023.CH26
3 EPA. (2022). Climate change indicators: Heat waves. Retrieved February 6, 2023, from https://www.epa.gov/climate-indicators/climate-change-indicators-heat-waves
4 Dutcher, A. (2022, June 22). Weekly agricultural weather update—June 22, 2022. Nebraska State Climate Office. Retrieved December 8, 2023, from https://nsco.unl.edu/articles/weather-updates/weekly-agricultural-weather-update-june-22-2022
5 Safchik, J. (2022, June 20). College World Series fans feel the heat in Omaha. KETV Omaha. https://www.ketv.com/article/omaha-college-world-series-fans-hot-weather/40353127
6 Centers for Disease Control and Prevention. (2024). Heat and athletes. Retrieved June 18, 2024, from https://www.cdc.gov/heat-health/risk-factors/heat-and-athletes.html
7 EPA. (n.d.). Learn about heat islands [Overviews and Factsheets]. Heat Islands. Retrieved December 8, 2023, from https://www.epa.gov/heatislands/learn-about-heat-islands
8 EPA. (n.d.). Climate change and heat islands. Heat Islands. Retrieved December 8, 2023, from https://www.epa.gov/heatislands/climate-change-and-heat-islands
9 EPA. (2024). Climate change indicators: U.S. and global temperature. Retrieved June 18, 2024, from https://www.epa.gov/climate-indicators/climate-change-indicators-us-and-global-temperature
10 Maxwell, K., Julius, S., Grambsch, A., Kosmal, A., Larson, L., & Sonti, N. (2018). Ch. 11. Built environment, urban systems, and cities. In D. R. Reidmiller, C. W. Avery, D. R. Easterling, K. E. Kunkel, K. L. M. Lewis, T. K. Maycock, & B. C. Stewart (Eds.), Impacts, risks, and adaptation in the United States: Fourth National Climate Assessment, volume II (pp. 438–478). U.S. Global Change Research Program. https://doi.org/10.7930/NCA4.2018.CH11
11 NOAA Climate Program Office, National Environmental Modeling and Analysis Center, & University of North Carolina Asheville. (2023). The Climate Explorer: Omaha, NE. U.S. Climate Resilience Toolkit Climate Explorer. Retrieved June 1, 2023, from https://crt-climate-explorer.nemac.org/climate_graphs/?city=Omaha%2C+NE&county=Douglas%2BCounty&area-id=31055&fips=31055&zoom=7&lat=41.2565369&lon=-95.9345034&id=days_tmax_gt_90f
12 EPA. (2021). Climate change indicators: Heat-related deaths. Retrieved June 18, 2024, from https://www.epa.gov/climate-indicators/climate-change-indicators-heat-related-deaths
13 Centers for Disease Control and Prevention. (2024). Heat and older adults (Aged 65+). Extreme Heat. Retrieved June 18, 2024, from https://www.cdc.gov/extreme-heat/risk-factors/extreme-heat-and-older-adults-aged-65.html
14 EPA. (2021). Climate change indicators: Heavy precipitation. Retrieved February 6, 2023, from https://www.epa.gov/climate-indicators/climate-change-indicators-heavy-precipitation
15 Frankson, R., Kunkel, K. E., Stevens, L. E., Shulski, M., Umphlett, N. A., & Stiles, C. J. (2022). Nebraska state climate summary 2022 (NOAA Technical Report NESDIS 150-NE). NOAA National Environmental Satellite, Data, and Information Service. https://statesummaries.ncics.org/chapter/ne/
16 Orr, M. (2020). On the potential impacts of climate change on baseball and cross-country skiing. Managing Sport and Leisure, 25(4), 307–320. https://doi.org/10.1080/23750472.2020.1723436
17 NOAA. (n.d.). Air pressure. JetStream. Retrieved December 8, 2023, from https://www.noaa.gov/jetstream/atmosphere/air-pressure
18 Callahan, C. W., Dominy, N. J., DeSilva, J. M., & Mankin, J. S. (2023). Global warming, home runs, and the future of America’s pastime. Bulletin of the American Meteorological Society, 104(5), E1006–E1016. https://doi.org/10.1175/BAMS-D-22-0235.1
19 Agency for Toxic Substances and Disease Registry. (2020). Extreme heat adaptation. Place and Health. Retrieved June 18, 2024, from https://www.atsdr.cdc.gov/placeandhealth/share/onemap_heat-crsci/extreme_heat_home.html
20 EPA. (n.d.). Reduce urban heat island effect. Green Infrastructure. Retrieved June 18, 2024, from https://www.epa.gov/green-infrastructure/reduce-urban-heat-island-effect
21 EPA. (n.d.). Using trees and vegetation to reduce heat islands [Overviews and Factsheets]. Heat Islands. Retrieved December 8, 2023, from https://www.epa.gov/heatislands/using-trees-and-vegetation-reduce-heat-islands
22 EPA. (n.d.). Using cool pavements to reduce heat islands [Overviews and Factsheets]. Heat Islands. Retrieved December 8, 2023, from https://www.epa.gov/heatislands/using-cool-pavements-reduce-heat-islands
23 EPA. (n.d.). Using cool roofs to reduce heat islands [Overviews and Factsheets]. Heat Islands. Retrieved December 8, 2023, from https://www.epa.gov/heatislands/using-cool-roofs-reduce-heat-islands