How to Interpret EJScreen Data

Block Groups
The standard unit of analysis in EJScreen is the Census "block group." A block group is an area defined by the Census Bureau that usually has in the range of 600-3,000 people living in it. The US is divided into more than 230,000 block groups. Block group resolution is the finest level of detail that Census data can be publicly shared.
Buffers
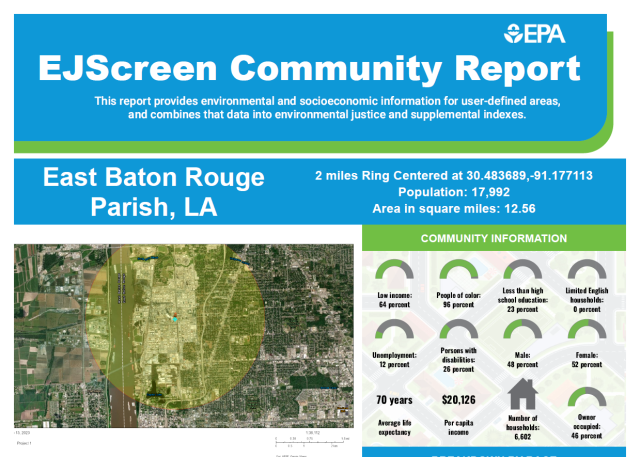
EJScreen utilizes "buffers" to identify an area on the map that includes everyone who lives within a certain distance of a point, line, or polygon. A point might be a factory seeking an emissions permit, for example, and the report could focus on the demographics and environmental conditions within approximately 1 mile of that factory.
In EJScreen, buffers can be drawn up to 10 miles around a point, line, or polygon. If you have selected a geographic point, the tool will apply a buffer around that point. The buffer ring will aggregate appropriate portions of the intersecting block groups, weighted by population, to create a representative set of data for the entire ring area, honoring variation and dispersion of the population in the block groups within it. For each indicator, the result is a population-weighted average, which equals the block group indicator values averaged over all residents who are estimated to be inside the buffer.
"Percentiles" are an important part of EJScreen. Every indicator in EJScreen is put into perspective by showing its associated percentiles.
Percentiles
A percentage is an absolute term. If you received 80% on a test of one hundred questions you had 80 correct answers.
A percentile is a relative term, and tells you how you have done on the test in comparison to the others who took the test. A percentile of 80 means that you scored equal to or better than 80% of people who took the test.
In EJScreen, if your results indicate that an area is 48% minority and is at the 69th national percentile, this means that 48% of the area’s population is minority, and that is an equal or higher % minority than where 69% of the US population lives.
Percentiles are a way to see how local residents compare to everyone else in the United States. Instead of just showing numbers out of context, EJScreen lets you compare a community to the rest of the state, EPA region and nation, by using percentiles. The national percentile tells you what percent of the US population has an equal or lower value, meaning less potential for exposure/ risk/ proximity to certain facilities, or a lower percent minority.
EJScreen includes state and national percentiles for each of the environmental and socioeconomic indicators and for the indexes.
U.S. versus State Comparison Levels
The U.S. percentile uses the U.S. population as the basis of comparison. The state percentile is calculated based on the population in a given state (or District of Columbia or Puerto Rico).
The state and U.S. percentiles will be similar if the state and U.S. average indicator values are similar. However, if the state average is lower than the U.S. average, the state percentile shown will be higher than U.S. percentile shown. Alternatively, if the state average is higher than the U.S. average, the state percentile shown will be lower than U.S. percentile shown. The state percentile being lower than the U.S. percentile does not mean the indicator value is lower in the given place, it just means the state average is higher than the U.S. average.
The difference between state and U.S. percentiles becomes apparent mainly in two situations: when comparing places across states, or when comparing results to some pre-determined, specific reference percentile (e.g., 80th percentile).
Initial Filter Approach for Screening
In past screening experience, EPA has found it helpful to establish a suggested Agency starting point for the purpose of identifying geographic areas that may warrant further consideration, analysis, or outreach. The use of an initial filter promotes consistency and provides a pragmatic first step for EPA programs and regions when interpreting screening results. For early applications of EJScreen, EPA identified the 80th percentile filter as that initial starting point. In other words, an area with any of the 13 EJ Indexes at or above the 80th percentile nationally should be considered as a potential candidate for further review.
Further review may include considering other factors and other sources of information such as health-based information, local knowledge, proximity and exposure to environmental hazards, susceptible populations, unique exposure pathways, and other federal, regional, state, and local data. This filter is simply a starting point, and program offices and regions should perform additional analysis before making any decisions about potential environmental justice issues. As EPA gains further experience and insight into the performance of the tool and its applicability for different uses, program offices and regions may opt to designate starting points that are more inclusive or specifically tailored to meet programmatic needs more effectively.
The 80th percentile filter in EJScreen is not intended to designate an area as an “EJ community.” EJScreen provides screening level indicators, not a determination of the existence or absence of EJ concerns. The Agency may revise this approach in the future based on experience.
